Learning BoS and CHoChThis is my first time learning SMC concepts. I have tried to mark Break of structure and Change of character on weekly chart then changed it to daily chart to see deeper understanding. Please comment and provide your opinion.
TDPOWERSYS trade ideas

Darvas Box Strategy - Break out Stock - Swing TradeDisclaimer: I am Not SEBI Registered adviser, please take advise from your financial adviser before investing in any stocks. Idea here shared is for education purpose only.
Stock has given break out. Buy above high. Keep this stock in watch list.
Buy above the High and do not forget to keep stop loss, best suitable for swing trading.
Target and Stop loss Shown on Chart. Risk to Reward Ratio/ Target Ratio 1:1
Stop loss can be Trail when it make new box / Swing.
Be Discipline, because discipline is the key to Success in Stock Market.
Trade what you See Not what you Think.

TDPOWER SYSTEMS - Likely to resume the Up Trend?The stock was in an uptrend and met with some price rejection in the range of 436 to 451, then it was pushed down to below 50 DMA. Then we saw some strength coming back below the 50 DMA and then today we saw an “Effort to move up” bar. Now the price is at the supply line and once the supply line is broken then we can see the stock testing the previous rejection zone and with some momentum it could take out the Price Rejection Zone and move up. Now the buying pressure and the money flow are positive while the relative strength is on the verge of turning positive. There is some good volume support as well. We also could see some committed buying coming in terms of delivery volumes. So, looks like the momentum is building up and this should see a stock being pushed up to test the rejection zone and further up. In other words the stock look likely to resume the Up Trend.


TDPS preparing for a zonal breakout and 15-20% rally!!The stock had given a successful breakout from a major resistance/supply zone of INR263-270 in Nov 2023 and subsequently formed a one month trading range right above the breakout zone.
INR 285-290 is now the new resistance zone that the stock is now eyeing to breakout out from in order to go past the INR 300 mark.
On Wednesday's trading session the stock broke out from a minor trend line resistance with a slight uptick in volume. This minor breakout can provide the necessary fuel for the stock to clear the INR285-290 zone with some momentum.
CMP - 278
SL - 264(5%)
TARGET - 320(15%)
RR - 1:3
Note*- Not a suggestion to buy/sell but a personal opinion on the stock. Please do your own research before taking any investing/trading decisions.

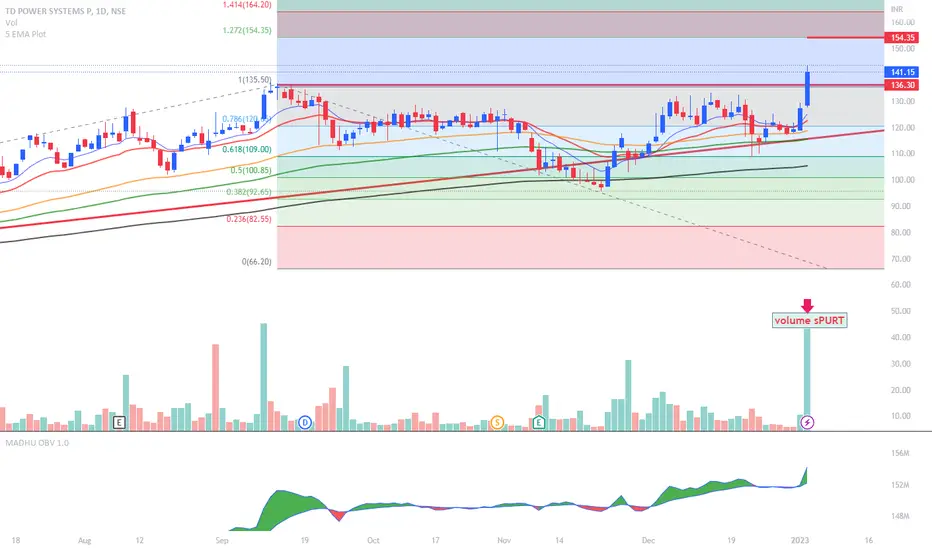
TD Power SystemsThe company is one of the leading manufacturers of AC generators in the range of 1 MW up to 250 MWA for prime movers such as steam & gas, hydro, wind turbines and diesel and gas engines. Its generators are approved by leading engineering consultants.
Tranding above 21 , 63 , 100 , 200 EMA - Enter for target 154 / 165 with SL of 135
Market Cap
₹ 2,201 Cr.
Stock P/E
27.1
Book Value
₹ 35.6
Dividend Yield
0.50 %
ROCE
16.2 %
ROE
12.9 %
Face Value
₹ 2.00
Promoter holding
58.4 %
EPS last year
₹ 4.54
EPS latest quarter
₹ 1.28
Debt
₹ 0.00 Cr.
Pledged percentage
0.00 %
Net CF
₹ 7.94 Cr.
Price to Cash Flow
202
Free Cash Flow
₹ -3.92 Cr.
Debt to equity
0.00
OPM last year
12.2 %
OPM 5Year
8.79 %
Reserves
₹ 525 Cr.
Price to book value
3.96
Int Coverage
54.4
PEG Ratio
0.35
Triangle Pattern BreakoutPlease look into the chart for a detailed understanding.
Consider these for short-term & swing trades with 2% profit.
For BTST trades consider booking
target for 1% - 2%
For long-term trades look out for resistance drawn above closing.
Please consider these ideas for educational purpose

TDPOWER- Curve PatternNSE:TDPOWER (163)
1. Support & Resistance Levels:
Support levels: 150 (Resistance becomes support)
Resistance levels: 185-200
2. Pattern:
The stock is currently trading above the curve pattern breakout with a flat resistance level at around 167 and a recent uptrend supporting upside movement
3. Volume Analysis:
The trading volume has spiked during the recent upside movement
4. Price & Trend Analysis:
The stock has been in a bullish trend since the beginning of 2022 and has been making higher highs and higher lows.
The current pattern is a bullish continuation pattern, indicating that the uptrend is likely to continue.
5. Conclusion:
Based on the technical analysis, the stock is showing signs of strength and is likely to continue its bullish trend.
A breakout above the resistance level of 167.5 could trigger a sharp move towards the next resistance level at 185-200.
#TechnicalAnalysiswithMrChartist

TD POWERSYSTEMS - RETEST AND BOUNCE Looking great as per chart , as long as its trading above 50ma in weekly charts , its good , best buy around 50ma in weekly , best sell 165.00 + , stoploss any weekly closing below 50ma in weekly .

VCPVCP characteristics, volume dry-up along the base
Relative strength line new highs
Trading above key moving averages
Pivot buy at 491
Stop at days low
Testing with small size, position size 10% of portfolio
Not an investment/trading advise. Publishing for my own reference.

TDPOWERSYS NSE BULLISHVIEW ABOVE 510 CMP 525TDPOWERSYS NSE is bullish if 510 holds. Near LIFETIME High. Fresh Breakout. Positive Trend.
Disclaimer: Educational Purpose Only. Not Buy Sell Reco. Not Sebi Registered.

TDPOWERSYS breakout through earlier consolidate areabreakout through earlier consolidate area with volume. need to keep into watchlist

TD Pwer systemThe sector should have tailwind due to infra push by the Government, The stock is moving nicely in upward direction, seems good to reach 135+, sl:96
Disclaimer: The stock/index/currency discussed do not constitute Investment advise and is merely an effort towards enhancing learning, knowledge and book keeping. Kindly do your own due diligence and or consult investment advisor before making any investment decisions.

