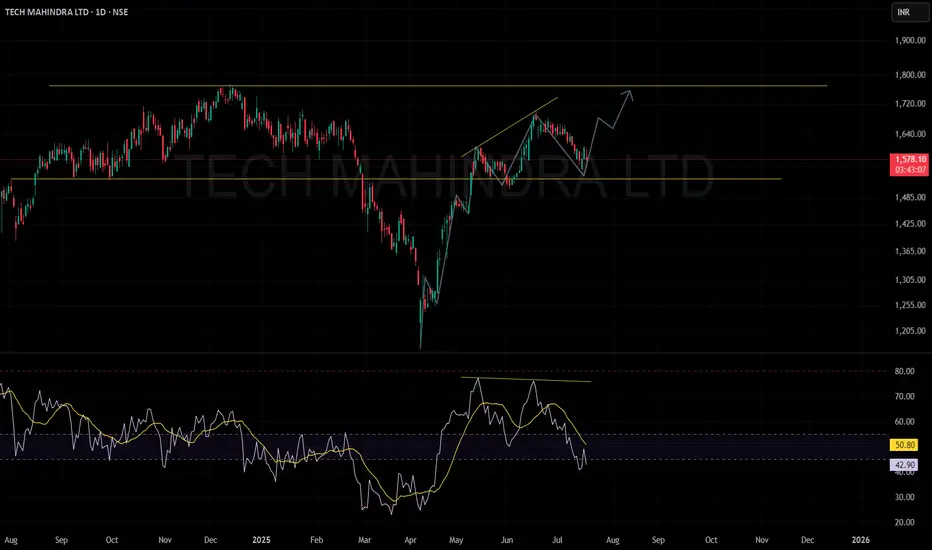
TECH MAHINDRA POISED FOR AN UPMOVE#TECHMAHINDRA
Support and Resistance:
A support zone is identified near ₹1,500 (lower yellow horizontal line).
The resistance zone is marked around ₹1,800 (indicated by the upper yellow horizontal line).
Trend Analysis:
Following a significant decline, the stock has shown a sharp recovery and is n
Next report date
—
Report period
—
EPS estimate
—
Revenue estimate
—
51.35 INR
42.52 B INR
529.88 B INR
634.79 M
About TECH MAHINDRA LTD
Sector
Industry
CEO
Mohit Joshi
Website
Headquarters
Pune
Founded
2010
ISIN
INE669C01036
FIGI
BBG000CXKQ30
Tech Mahindra Ltd. operates as a holding company. It engages in the provision of information technology solutions. The firm operates through the Information Technology Services and Business Processing Outsourcing segments. It provides computer programming, consultancy and related services, networking technology solutions, and business support services to the global telecommunications industries. The company was founded on October 24, 1986 and is headquartered in Pune, India.
Related stocks
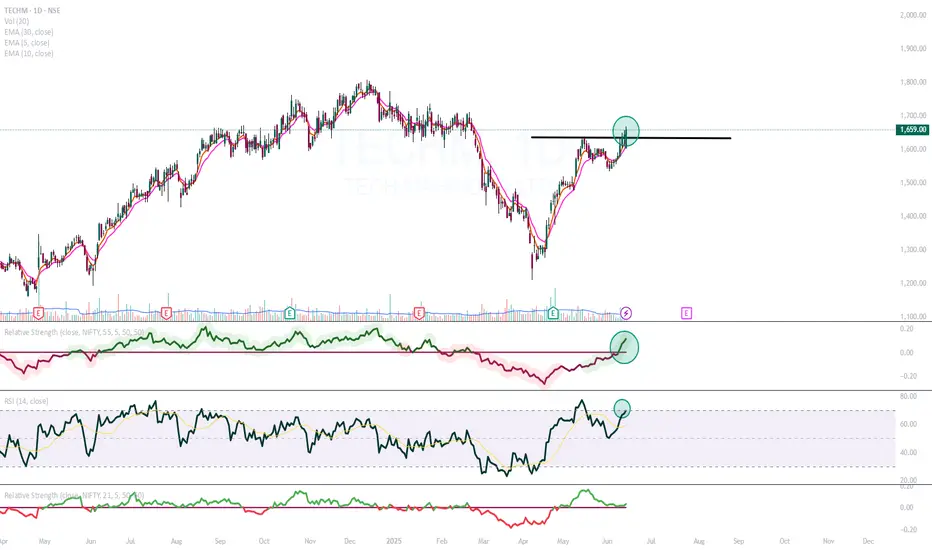
TECHM Looks interestingIT sector is doing relatively well.
Techm from the IT sector particularly looking very interesting.
RS is positive
RSI above 60
Break out with good volume
TECH MAHINDRA is now moving towords upwords 1740TECH MAHINDRA Is showing momentum after clean liquidity sweep , it will take time within 4 days it will touch 1740, lets see price action

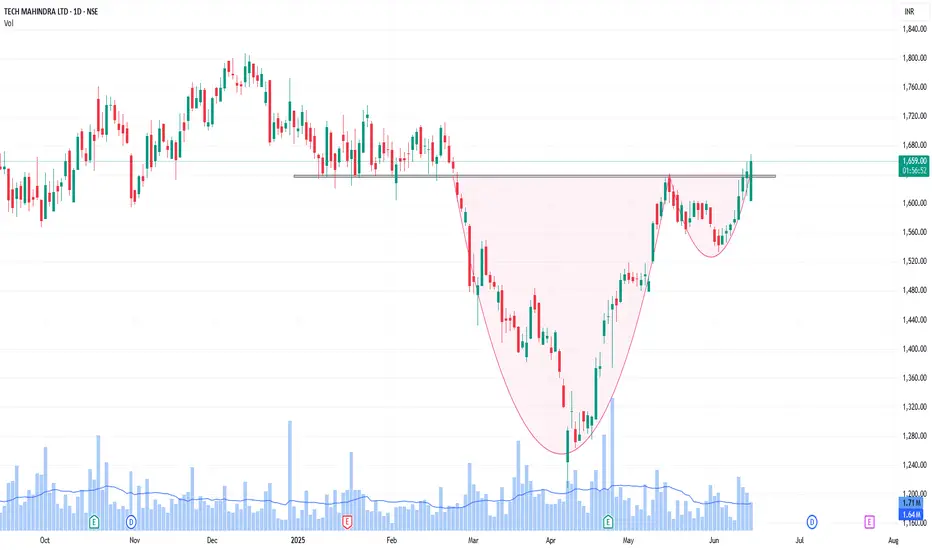
Techm - cup and holder breakoutNSE:TECHM
Cup and handle breakout in TechM
Also it breaking the long resistance 1630-1650
TECH_Neutral Price near the recent Resistance
Watch this stock for next 2 days.
If you get a good entry point, Go Long - with very tight SL

TECH MAHINDRA FOR SHORT TERM VIEW 1490TECH MAHINDRA IS in downside for short term and may will fall till 1490, so watch it for short term, hope tgt will soon reach

Tech Mahindra Ltd view for Intraday 23rd May #TECHM Tech Mahindra Ltd view for Intraday 23rd May #TECHM
Resistance 1580 Watching above 1585 for upside momentum.
Support area 1550 Below 1560 ignoring upside momentum for intraday
Watching below 1547 for downside movement...
Above 1560 ignoring downside move for intraday
Charts for Educational purpo

Tech Mahindra Ltd view for Intraday 14th May #TECHM Tech Mahindra Ltd view for Intraday 14th May #TECHM
Resistance 1580 Watching above 1583 for upside movement...
Support area 1550 Below 1550 ignoring upside momentum for intraday
Watching below 1546 for downside movement...
Above 1580 ignoring downside move for intraday
Charts for Educational pur

Tech Mahindra Ltd view for Intraday 25th April #TECHM Tech Mahindra Ltd view for Intraday 25th April #TECHM
Resistance 1450-1455 Watching above 1456 for upside movement...
Support area 1400 Below 1440 ignoring upside momentum for intraday
Watching below 1396 for downside movement...
Above 1420 ignoring downside move for intraday
Charts for Educati

TECHM | can be buy with a tight stop-loss.If the stop-loss hits, no worries, we just have to follow the plan and try again.
Disclaimer:
This is not financial advice. Please do your own research or consult with a financial advisor before making any investment decisions. Investments in stocks can be risky and may result in loss of capital

See all ideas
Summarizing what the indicators are suggesting.
Neutral
SellBuy
Strong sellStrong buy
Strong sellSellNeutralBuyStrong buy
Neutral
SellBuy
Strong sellStrong buy
Strong sellSellNeutralBuyStrong buy
Neutral
SellBuy
Strong sellStrong buy
Strong sellSellNeutralBuyStrong buy
An aggregate view of professional's ratings.
Neutral
SellBuy
Strong sellStrong buy
Strong sellSellNeutralBuyStrong buy
Neutral
SellBuy
Strong sellStrong buy
Strong sellSellNeutralBuyStrong buy
Neutral
SellBuy
Strong sellStrong buy
Strong sellSellNeutralBuyStrong buy
Displays a symbol's price movements over previous years to identify recurring trends.
Frequently Asked Questions
The current price of TECHM is 1,461.90 INR — it has decreased by −2.45% in the past 24 hours. Watch TECH MAHINDRA LTD stock price performance more closely on the chart.
Depending on the exchange, the stock ticker may vary. For instance, on NSE exchange TECH MAHINDRA LTD stocks are traded under the ticker TECHM.
TECHM stock has fallen by −7.06% compared to the previous week, the month change is a −13.49% fall, over the last year TECH MAHINDRA LTD has showed a −4.14% decrease.
We've gathered analysts' opinions on TECH MAHINDRA LTD future price: according to them, TECHM price has a max estimate of 2,020.00 INR and a min estimate of 1,110.00 INR. Watch TECHM chart and read a more detailed TECH MAHINDRA LTD stock forecast: see what analysts think of TECH MAHINDRA LTD and suggest that you do with its stocks.
TECHM reached its all-time high on Dec 30, 2021 with the price of 1,838.00 INR, and its all-time low was 51.25 INR and was reached on Jan 23, 2009. View more price dynamics on TECHM chart.
See other stocks reaching their highest and lowest prices.
See other stocks reaching their highest and lowest prices.
TECHM stock is 3.13% volatile and has beta coefficient of 0.76. Track TECH MAHINDRA LTD stock price on the chart and check out the list of the most volatile stocks — is TECH MAHINDRA LTD there?
Today TECH MAHINDRA LTD has the market capitalization of 1.43 T, it has increased by 0.49% over the last week.
Yes, you can track TECH MAHINDRA LTD financials in yearly and quarterly reports right on TradingView.
TECH MAHINDRA LTD is going to release the next earnings report on Oct 22, 2025. Keep track of upcoming events with our Earnings Calendar.
TECHM earnings for the last quarter are 12.90 INR per share, whereas the estimation was 13.26 INR resulting in a −2.70% surprise. The estimated earnings for the next quarter are 14.23 INR per share. See more details about TECH MAHINDRA LTD earnings.
TECH MAHINDRA LTD revenue for the last quarter amounts to 133.51 B INR, despite the estimated figure of 134.08 B INR. In the next quarter, revenue is expected to reach 136.34 B INR.
TECHM net income for the last quarter is 11.41 B INR, while the quarter before that showed 11.67 B INR of net income which accounts for −2.24% change. Track more TECH MAHINDRA LTD financial stats to get the full picture.
TECH MAHINDRA LTD dividend yield was 3.17% in 2024, and payout ratio reached 93.74%. The year before the numbers were 3.20% and 150.02% correspondingly. See high-dividend stocks and find more opportunities for your portfolio.
As of Jul 26, 2025, the company has 119.34 K employees. See our rating of the largest employees — is TECH MAHINDRA LTD on this list?
EBITDA measures a company's operating performance, its growth signifies an improvement in the efficiency of a company. TECH MAHINDRA LTD EBITDA is 73.62 B INR, and current EBITDA margin is 13.48%. See more stats in TECH MAHINDRA LTD financial statements.
Like other stocks, TECHM shares are traded on stock exchanges, e.g. Nasdaq, Nyse, Euronext, and the easiest way to buy them is through an online stock broker. To do this, you need to open an account and follow a broker's procedures, then start trading. You can trade TECH MAHINDRA LTD stock right from TradingView charts — choose your broker and connect to your account.
Investing in stocks requires a comprehensive research: you should carefully study all the available data, e.g. company's financials, related news, and its technical analysis. So TECH MAHINDRA LTD technincal analysis shows the strong sell today, and its 1 week rating is sell. Since market conditions are prone to changes, it's worth looking a bit further into the future — according to the 1 month rating TECH MAHINDRA LTD stock shows the neutral signal. See more of TECH MAHINDRA LTD technicals for a more comprehensive analysis.
If you're still not sure, try looking for inspiration in our curated watchlists.
If you're still not sure, try looking for inspiration in our curated watchlists.