Time techno⏱️ Time Technoplast – Building Strength!
Clean technical setup, solid volume, and eyes on higher zones.
Positional traders, stay tuned ! 📈🚀
TIMETECHNO trade ideas

TIMETECHNOTIMETECHNO
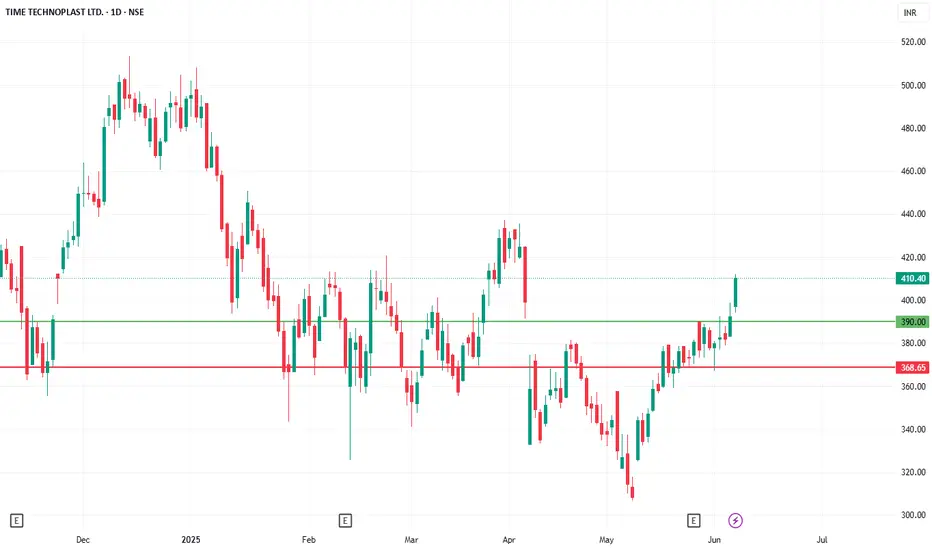
watch above levels. green line is our entry, redline is our SL.
DISCLAIMER : I am NOT a SEBI registered advisor or a financial adviser. All the views are for educational purpose only.
TIME TECHNOPLASTSEBI-Disclosure for Stock Analysis
For Informational Purposes Only: The analysis provided above is for educational and informational purposes only and is based on the technical interpretation of the supplied stock chart. It should not be construed as financial advice, investment advice, or a recommendation to buy, sell, or hold any security.
Not a Financial Advisor: I am an AI assistant and not a registered or qualified financial advisor, investment advisor, or stockbroker. The information presented is generated without considering your individual financial situation, risk tolerance, or investment objectives.
Risk of Loss: Trading and investing in financial markets, including equities, carry a significant risk of loss. The value of stocks can fluctuate, and you may lose part or all of your investment. Past performance is not indicative of future results.
Consult a Professional: Before making any investment decisions, you should conduct your own thorough research and/or consult with a qualified financial professional to assess your personal circumstances and the suitability of any investment.
Information Accuracy: While this analysis is based on the data visible in the chart, it does not account for all possible market variables, including fundamental factors (like company earnings, debt, management) or macroeconomic events (like interest rate changes, government policies) that can impact the stock's price.

TIME TECHNOPLAST LTD S/RSupport and Resistance Levels:
Support Levels: These are price points (green line/shade) where a downward trend may be halted due to a concentration of buying interest. Imagine them as a safety net where buyers step in, preventing further decline.
Resistance Levels: Conversely, resistance levels (red line/shade) are where upward trends might stall due to increased selling interest. They act like a ceiling where sellers come in to push prices down.
Breakouts:
Bullish Breakout: When the price moves above resistance, it often indicates strong buying interest and the potential for a continued uptrend. Traders may view this as a signal to buy or hold.
Bearish Breakout: When the price falls below support, it can signal strong selling interest and the potential for a continued downtrend. Traders might see this as a cue to sell or avoid buying.
20 EMA (Exponential Moving Average):
Above 20 EMA(50 EMA): If the stock price is above the 20 EMA, it suggests a potential uptrend or bullish momentum.
Below 20 EMA: If the stock price is below the 20 EMA, it indicates a potential downtrend or bearish momentum.
Trendline: A trendline is a straight line drawn on a chart to represent the general direction of a data point set.
Uptrend Line: Drawn by connecting the lows in an upward trend. Indicates that the price is moving higher over time. Acts as a support level, where prices tend to bounce upward.
Downtrend Line: Drawn by connecting the highs in a downward trend. Indicates that the price is moving lower over time. It acts as a resistance level, where prices tend to drop.
Disclaimer:
I am not a SEBI registered. The information provided here is for learning purposes only and should not be interpreted as financial advice. Consider the broader market context and consult with a qualified financial advisor before making investment decisions.

TIMETECH S/R Support and Resistance Levels:
Support Levels: These are price points (green line/shade) where a downward trend may be halted due to a concentration of buying interest. Imagine them as a safety net where buyers step in, preventing further decline.
Resistance Levels: Conversely, resistance levels (red line/shade) are where upward trends might stall due to increased selling interest. They act like a ceiling where sellers come in to push prices down.
Breakouts:
Bullish Breakout: When the price moves above resistance, it often indicates strong buying interest and the potential for a continued uptrend. Traders may view this as a signal to buy or hold.
Bearish Breakout: When the price falls below support, it can signal strong selling interest and the potential for a continued downtrend. Traders might see this as a cue to sell or avoid buying.
20 EMA (Exponential Moving Average):
Above 20 EMA(50 EMA): If the stock price is above the 20 EMA, it suggests a potential uptrend or bullish momentum.
Below 20 EMA: If the stock price is below the 20 EMA, it indicates a potential downtrend or bearish momentum.
Trendline: A trendline is a straight line drawn on a chart to represent the general direction of a data point set.
Uptrend Line: Drawn by connecting the lows in an upward trend. Indicates that the price is moving higher over time. Acts as a support level, where prices tend to bounce upward.
Downtrend Line: Drawn by connecting the highs in a downward trend. Indicates that the price is moving lower over time. It acts as a resistance level, where prices tend to drop.
RSI: RSI readings greater than the 70 level are overbought territory, and RSI readings lower than the 30 level are considered oversold territory.
Combining RSI with Support and Resistance:
Support Level: This is a price level where a stock tends to find buying interest, preventing it from falling further. If RSI is showing an oversold condition (below 30) and the price is near or at a strong support level, it could be a good buy signal.
Resistance Level: This is a price level where a stock tends to find selling interest, preventing it from rising further. If RSI is showing an overbought condition (above 70) and the price is near or at a strong resistance level, it could be a signal to sell or short the asset.
Disclaimer:
I am not a SEBI registered. The information provided here is for learning purposes only and should not be interpreted as financial advice. Consider the broader market context and consult with a qualified financial advisor before making investment decisions.

50 SMA Rising- Positional TradeDisclaimer: I am not a Sebi registered adviser.
This Idea is publish purely for educational purpose only before investing in any stocks please take advise from your financial adviser.
Its 50 SMA Rising Strategy. Suitable for Positional Trading Initial Stop loss lowest of last 2 candles and keep trailing with 50 days SMA if price close below 50 SMA then Exit or be in the trade some time trade can go for several months.
Be Discipline because discipline is the Key to Success in the STOCK Market.
Trade What you see not what you Think

Technical Analysis of TIME TECHNOPLAST Ltd (TIMETECHNO)Technical Analysis of TIME TECHNOPLAST Ltd (TIMETECHNO)
The technical analysis chart of TIME TECHNOPLAST Ltd (TIMETECHNO) on a 1-hour timeframe. The chart includes price action, support and resistance levels, Fibonacci retracements, a short-term target, and an RSI indicator.
Key Observations:
Price Action: - The price is currently trading near the 0.236 Fibonacci retracement level of the recent uptrend. There is potential for a pullback towards the 0.382 level or even the 0.50 level before resuming the uptrend.
Support and Resistance: - The 360.00 level acts as a key support level. If the price breaks below this level, it could signal a potential reversal. The 460.00 level is a significant resistance level and a potential target for profit booking.
Fibonacci Retracements: - The 0.618 and 0.786 Fibonacci retracement levels are also important to watch, as they could provide further support or resistance.
Short-Term Target: The short-term target is set at 430.00. If the price reaches this level, it could be a good opportunity to take profits.
RSI Indicator: The RSI is currently below 50, indicating that the stock is oversold. This could suggest a potential rebound in the price.
Trading Strategy based on my Technical Analysis:
Buy Above 388.00: If the price breaks above the 336.00 level, it could signal a potential reversal and a resumption of the uptrend. Traders could consider buying at this level to accumulate average.
Buy More Above 377.45: If the price breaks above the 377.45 level, it could indicate a stronger uptrend. Traders could consider starting to buy at this level.
Book Profit Above 460.00: If the price reaches the 460.00 level, it could be a good opportunity to take profits, as this level represents a significant resistance area.
Disclaimer: This analysis is based on the technical analysis with the help of indicators. It is important to conduct your own research and consider other factors before making any investment decisions. Technical analysis is not foolproof, and past performance does not guarantee future results. I am not SEBI registered person to suggest any stock.
Thanks for your support as always

Technical Analysis of Time Technoplast Ltd (Bullish)Technical Analysis of Time Technoplast Ltd (TIMETECHNO)
Overview of the Stock - The chart suggests a bullish sentiment for Time Technoplast Ltd (TIMETECHNO). The price is currently trading above several key support levels and indicators, indicating potential upward momentum.
My Personal Observations
Uptrend: The overall price action suggests an uptrend. The price is consistently making higher highs and higher lows.
Support Levels: Several horizontal lines are drawn on the chart, potentially acting as support levels. The price is currently above these levels, which is bullish.
Resistance Levels: The 430 level is marked as a "Short Term Target." This could be a potential resistance level where the price might face selling pressure.
EMA (200): The 200-day Exponential Moving Average (EMA) is below the current price, which is generally considered a bullish signal.
RSI (14): The Relative Strength Index (RSI) is above 50, indicating bullish momentum. However, it's approaching the overbought zone (70), which could signal a potential short-term correction.
Trading Ideas (Based on Chart Technical Analysis)
Bullish Bias: The overall chart pattern suggests a bullish outlook.
Buy Entry: Consider buying above the 384 level, as indicated on the chart.
Stop-Loss: A stop-loss can be placed below the nearest support level.
Take-Profit: The short-term target is marked at 430. However, it's essential to consider other factors and potential resistance levels.
Risk Management: Implement proper risk management techniques, such as position sizing and using stop-loss orders.
Fundamental Analysis: While this analysis focuses on technical indicators, it's crucial to consider the company's financial performance and industry trends for a comprehensive investment decision.
Remember: This analysis is for informational purposes only and should not be considered financial advice. Conduct your own research or consult with a financial advisor before making investment decisions.
Disclaimer: This analysis is based solely on the provided chart and technical indicators. It does not consider fundamental factors or other market influences. Trading involves risk, and it's essential to conduct thorough research and consider your risk tolerance before making investment decisions. This is my personal opinion and not an investment advice because I am not SEBI registered person
Thanks for your support as always

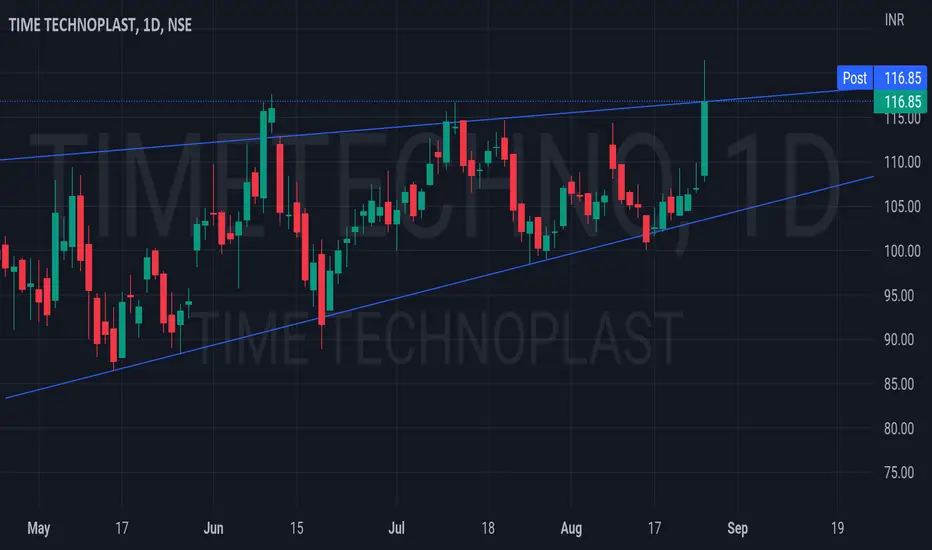
2 possibilitiesGood volume buildup in daily & weekly timeframe.
Ascending wedge and ATH breakout of supply zone with good volume.
Price is in uptrend even in this unpredictable market as most of the tome taken support at 50EMA.
Wait for retest for conformation to get the price a non-premium zone.
Fundamental's looks good.
FII and DII stakes are up.
NOTE: I do my analysis, do yours before trade.

NSEI:TIMETECHNO - Short term uptrend or big trend???👇NSE:TIMETECHNO
Time Technoplast Limited, together with its subsidiaries, engages in manufacture and sale of a range of technology-based polymer and composite products in India and internationally. It operates in two segments, Polymer and Composite. The company offers industrial packaging products, including drums and containers, such as narrow mouth polycans/drums, open top drums, XL-rings, medium packing products, and classic open top drums; conipails; and intermediate bulk containers, as well as value added services.
It also provides lifestyle products comprising matting products; bins; and molded furniture, such as sofas, five position reclining chairs, monoblocs, executive and baby chairs, chairs with writing desk, tables, trolleys, and stools for use in homes, hotels, restaurants, hospitals, clubs, airlines, auditoriums and tent houses, and various other institutes; and automotive components, such as 3S rain flaps, deaeration tanks/radiator tanks, fuel tanks, and air ducts. In addition, the company offers material handling products consisting of plastic returnable transit packaging and material handling solutions, crates, flat plates, eco plates, and smart leaf plates, and export pallets to retail, automotive, agriculture, processed food, apparel, pharmaceutical, FMCG, consumer durables, and logistics sectors. Further, it provides composite cylinders; and infrastructure products, including HDPE and DWC pipes, and energy storage devices, as well as techpaulin bags, raincoats, bike covers, and cross laminated films; and kavach face shield. The company was incorporated in 1989 and is based in Mumbai, India.
disc: Invested

NSEI:TIMETECHNO - Playing a catchup gain or trend reversalNSE:TIMETECHNO
Time Technoplast Limited and its subsidiaries produce and sell various technology-based polymer and composite products in India and globally.
The company operates in two main segments - Polymer and Composite.
The range of products includes industrial packaging products like drums, containers, and intermediate bulk containers.
The company also provides lifestyle products like matting products, bins, and molded furniture suitable for various establishments such as homes, hotels, and hospitals.
It manufactures automotive components including 3S rain flaps, deaeration tanks/radiator tanks, fuel tanks, and air ducts.
Time Technoplast Limited offers material handling products like plastic returnable transit packaging and crates used in various sectors such as retail, automotive, and pharmaceuticals.
Additionally, the company produces composite cylinders and infrastructure products like HDPE and DWC pipes, and energy storage devices.
The company's other products include techpaulin bags, raincoats, bike covers, cross-laminated films, and kavach face shield.
Time Technoplast Limited, incorporated in 1989, is headquartered in Mumbai, India.
Disc: Invested, key level marked that I am tracking
Please do your own research

Time Technoplast : (Weekly Chart)Packaging sector company showing traction on weekly chart with recent hydrogen cylinder entry as the pioneers in India:
Entry - 218-220
Weak below - 192
Expected levels - 400
Disc. No buy/sell recommendation.

TIME Technoplast looks bullishTIMETECHNO on a daily time frame. It has been on an uptrend for a long time. Recently it got corrected and continued uptrend.
Monthly & Weekly RSI is above 60 and daily RSI taking support near 50.
One can quickly notice "Positive Reverse Divergence." The price is making higher highs, and RSI is declining.
It would be a swing or short-term trade with a minimal stop loss with RRR 1:3

TIMETECHNO 109 Now, Opportunity for Med to Long term InvestorsTIMETECHNO 109 Now, Huge upmove possible in next 12-16 Months
FIB level suggests it is heading towards 160 levels.
Do your own research before investing...

Time Technoplast-Nice breakoutTime Technoplast-Nice breakout.
Capital to be deployed- 20k
Investing Price -124-126
Breakout Price -124
Stoploss-101
Targets-179
#timetechnoplast #StocksToBuy #StockMarket #StockToWatch #StocksInFocus #stockstowatch

Time Technoplast (Swing):Time Technoplast (Swing):
A 50-100% up move is on the cards for swing.
But you need to in patience.
Appropriate support, supply zone, resistance and targets are highlighted.
Note: Do your own due diligence before taking any action.
I would be posting updates for this chart in the comments sections as time progresses.

Time Technoplast Limited | CMP - 106.75While looking at a weekly timeframe we can see that this stock had a great bounce from its previous support which marked in dotted lines and volumes are also massive around it - showing its strength.
Turnaround is seen in the chart on weekly and the Price to Sales ratio looks attractive to me.
Weekly TF - https://www.
Also, the dotted line marked can also be said as Polarity Point - a point where once a Resistance (Support) level is breached, it changes its nature and becomes Support (Resistance)
.
Now, coming to daily timeframe - we can see that it took a trendline support from below (Dec 2021) which almost coincides with the polarity point, showing a good support.
There's a short term resistance at 107 levels marked with horizontal line, so one has to be cautious before entering.
.
Entry Points - Current Market Price i.e. ₹106.75, and ₹99.00
Risk Free entry - After ₹114 (marked with Blue Dotted lines)
Stoploss - Below ₹88
.
Fundamentally the stock also looks good, so you can go for long term.

time technoTime Technoplast Ltd. (TTL) is a multinational conglomerate that is a leading manufacturer of polymer products with operations in Bahrain, Egypt, Indonesia, India, Malaysia, U.A.E, Taiwan, Thailand, Vietnam, Saudi Arabia & the USA.
The company’s portfolio consists of products catering to growing industry segments like industrial packaging solutions, lifestyle products, automotive components, healthcare products, infrastructure or construction-related products, material handling solutions & composite cylinders. Value-added products (Intermediate Bulk Containers (IBC), Composite Cylinders (LPG & CNG), and MOX Films) contribute 21% of total revenue while established products (Polymer drums, jerry cans, PE pipes, turf & matting) had a 79% contribution.
Over the last couple of years, the company’s product mix has improved through the addition of new products, which is likely to yield diversification-related benefits and aid in revenue growth and profitability. Furthermore, TTL is one of the leading players in various product categories like industrial packaging products (Asia and MENA region), composite cylinders, and intermediate bulk containers (worldwide).
• For the first time in India by any company, Time Technoplast Ltd. received approval from regulatory authorities for manufacturing of Carbon Fibre Wrapped Type-IV Composite CNG cylinder for on-board (vehicle) application.
• Brownfield expansion of Rs. 186 Cr. in India and overseas locations will aid in future growth and leveraging of existing infrastructure.
• The pipes/ducts have substantial business potential, especially in government projects like Smart Cities, Jal Jeevan Mission, and Swachh Bharat Mission.
• Company innovating new applications of the MOX films and is launching new products in the market like Truck covers, Pond Liners, Mulching Film & Poly House Films. TTL continues to focus on export markets of Thailand, Malaysia, Germany UK & the USA.
Plant utilization levels returned back to pre-COVID levels supported by a positive demand scenario. TTL continued to maintain a good order book in the PE Pipe business exceeding Rs. 250 Cr. by FY22. The company currently has approvals in over 55 countries and is exporting composite cylinders to over 40 nations.
Management has updated that the company has received Rs. 150 Cr. for its Type-IV Composite cylinders for CNG Cascades and has also started receiving orders for the recently approved Type-IV Composite cylinders for on-board application. In addition, Government-owned Oil Marketing Companies (OMCs) have started to procure Type-IV LPG Composite cylinders with the company having received trial orders.

Add to your watchlist. Exactly in trendline resistance Exactly in trendline resistance in weekly time frame.

BUY oppertunity for TIME TECHNOPLAST hey guys ,
TIME TECHNOPLAST stock was moving in a uptrend in a fixed area
and now this stock has touched it's support area and made a candle called
A MORNING STAR
i have marked the RR RATIO for you ,
you can see the target and sl by zooming in the above image
RR RATIO is 3:1
try to trade according to that ratio or adjust it accordingly to you
TIME TECHNOPLAST 😀😀

TIMETECHNO testing the trendline #LONGTIMETECHNO testing the trendline and it looks good risk:reward (1:5.5) we can do a swing trade.....stoploss : when it breaks the trendline and gives a close...target at upper trendline (it's forming a triangle keep this in your radar)

Time TechnoPlast Measure 89.60 from the neck of the cup and the handle breakout from the lows of 22.60.
We get 156 which is the next target for
Time TechnoPlast
