Tamilnad Merca Bank trying to rise with volumes.Tamilnad Mercantile Bank Ltd. engages in the provision of banking services. It offers loan products, current accounts, business and prepaid cards, online and foreign exchange services. It operates through the following business segments: Treasury, Corporate/Wholesale Banking, and Retail Banking.
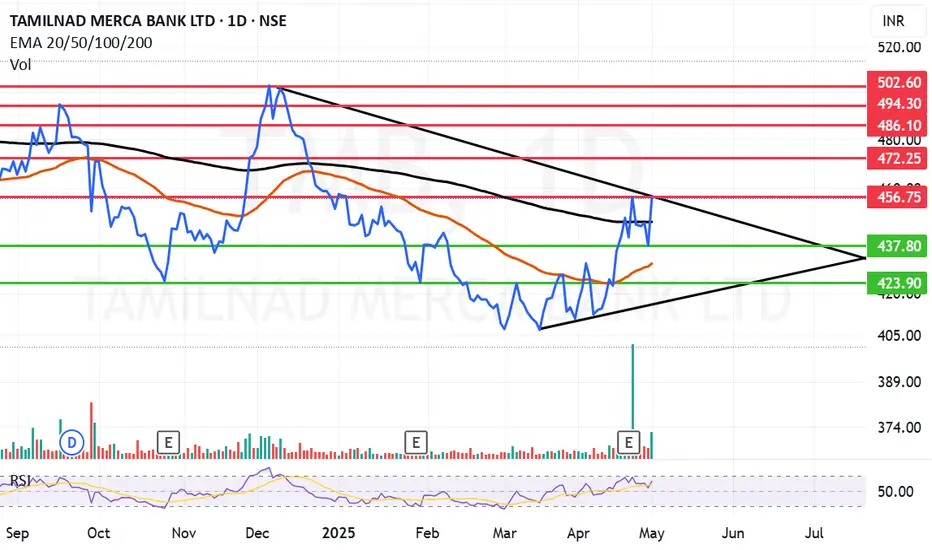
Tamilnad Mercantile Bank Ltd. Closing price is 456.10. The positive aspects of the company are Very Attractive Valuation (P.E. = 6.1), Companies with Zero Promoter Pledge, Companies with Low Debt, Company able to generate Net Cash - Improving Net Cash Flow, FII / FPI or Institutions increasing their shareholding and Mutual Funds Increased Shareholding over the Past Two Months. The Negative aspects of the company are Stocks Underperforming their Industry Price Change in the Quarter, Declining profits every quarter for the past 2 quarters and Increase in Provisions in Recent Results.
Entry can be taken after closing above 457 Historical Resistance in the stock will be 472 and 486. PEAK Historic Resistance in the stock will be 494 and 502. Stop loss in the stock should be maintained at Closing below 437 or 423 depending upon your risk taking ability.
Disclaimer: The above information is provided for educational purpose, analysis and paper trading only. Please don't treat this as a buy or sell recommendation for the stock or index. The Techno-Funda analysis is based on data that is more than 3 months old. Supports and Resistances are determined by historic past peaks and Valley in the chart. Many other indicators and patterns like EMA, RSI, MACD, Volumes, Fibonacci, parallel channel etc. use historic data which is 3 months or older cyclical points. There is no guarantee they will work in future as markets are highly volatile and swings in prices are also due to macro and micro factors based on actions taken by the company as well as region and global events. Equity investment is subject to risks. I or my clients or family members might have positions in the stocks that we mention in our educational posts. We will not be responsible for any Profit or loss that may occur due to any financial decision taken based on any data provided in this message. Do consult your investment advisor before taking any financial decisions. Stop losses should be an important part of any investment in equity.
TMB trade ideas
TMB Trading Above Fresh Demand ZoneTMB is currently trading at ₹456.85, above its fresh demand zone between ₹450.55 and ₹442.55, established on 27th November 2024. This untested zone reflects potential buying interest, and investors may monitor for signs of price action near this level to evaluate trading opportunities.
Disclaimer: This analysis is for informational purposes only and should not be considered as financial advice. Please conduct your own research or consult a financial advisor before making any investment or trading decisions.

Price Can see Big Move On TMB.Price Can see Big Move On TMB as price is getting rejected at demand, Make sure trend line break with volume.

TMBwe are looking TMB bullish move.
Disclaimer:
Kind regards to all friends and members ,
Stock market investment is subject to 100% market risks. Our company is not a SEBI registered company. Please consult your financial advisor before investing. This is for learning and training purposes only. Market Traps administrators are not responsible for any financial gains or losses resulting from your decisions. You acknowledge that stock market investments are highly risky and that you understand the market risks involved. Hence any legal action is void.

TMB (Tamilnadu merca bank) right to enter for swing ??no, this is not right time to enter swing . as per my anlysis ,choch happened, after choch it need to colloect poi. my entry at 455 and sl at 424 and my target at 796..
all my analysis for educational purpose only

Within a week - 20% Possible Reversal -20% is possible.
Note : I am not SEBI registered and all Ideas posted by me are for Educational Purpose.
Good luck!
Thanks & Regards,
RK

TMB a casual postI came across this script as it was tempting me to analyze, find the possible entry. But, When I actually viewed this script chart on trading view in conventional red and green type, I was astonished to see the quantum of red vs green candles.
This does not change my view or analysis as such for the script, but for a change it was an experience for me, so sharing it.

TMB TRIANGLE PATTERN SWING TRADEswing trade take trade when nifty turns bullish swing trade perfect symmetrical triangle short term opportunity for upside take trade after breakout from the trendline according to own risk this is not call just a analysis.

TMB - Weekly AnalysisIn the Weekly Chart of TMB ,
we can see that, it has created a Bullish hammer candle.
2 possible momentum has been shown in chart.


TMB bank Its i am looking for fall for TMT bank if not sustain at COM rate , Then its fall , If its moves up then find marking value at chart
