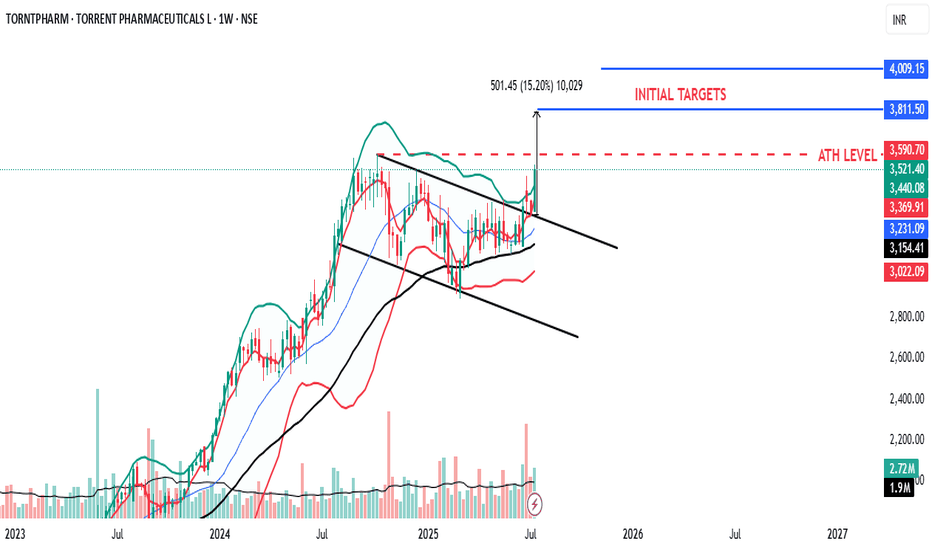
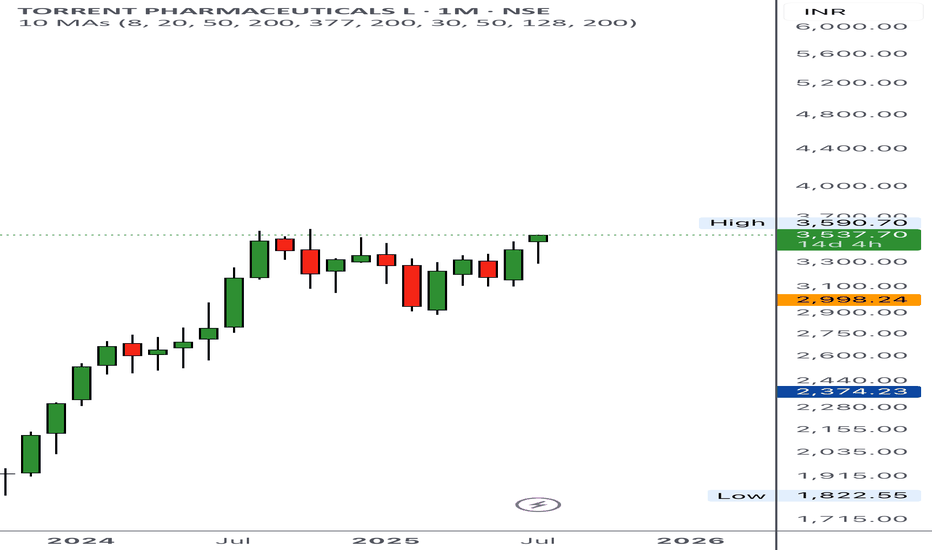
TORRENT PHARMA, Kindly do your own studyThis stock is ready to zoom. Stock is near all time high level and ready to break that level.
Monthly price is above 5 EMA
Monthly MACD flat after down
Monthly RSI is above 60
Weekly price is challenged upper bollinger band with good volume
Weekly MACD is in PCO stat and above zero line
Weekly RSI is above 60
Weekly ADX is strong
Daily RSI is in momentum
Daily ADX is strong
TORNTPHARM trade ideas
Torrent Pharmaceuticals 1DTorrent Pharmaceuticals, currently trading around ₹3,200, is poised to potentially break its all-time high. The stock has formed a bullish triangle pattern, indicating strong upward momentum
Disclaimer: The information provided is for educational and informational purposes only and should not be considered as financial advice. Investing in the stock market involves risk, and past performance is not indicative of future results. Please consult with a certified financial advisor or conduct your own research before making any investment decisions. We are not responsible for any losses incurred as a result of using this information. Stock market investments are subject to market risks; read all related documents carefully.
Torrent Pharma Ltd for Intraday 31st October #TORNTPHARM Torrent Pharma Ltd for Intraday 31st October #TORNTPHARM
Resistance 3150-3160. Watching above 3162 for upside movement...
Support area 3080. Below 3110 ignoring upside momentum for intraday
Support 3080 .Watching below 3078 for downside movement...
Resistance area 3150
Above 3110 ignoring downside move for intraday
Charts for Educational purposes only.
Please follow strict stop loss and risk reward if you follow the level.
Thanks,
V Trade Point
TORRENT PHARMA S/R Support and Resistance Levels:
Support Levels: These are price points (green line/shade) where a downward trend may be halted due to a concentration of buying interest. Imagine them as a safety net where buyers step in, preventing further decline.
Resistance Levels: Conversely, resistance levels (red line/shade) are where upward trends might stall due to increased selling interest. They act like a ceiling where sellers come in to push prices down.
Breakouts:
Bullish Breakout: When the price moves above resistance, it often indicates strong buying interest and the potential for a continued uptrend. Traders may view this as a signal to buy or hold.
Bearish Breakout: When the price falls below support, it can signal strong selling interest and the potential for a continued downtrend. Traders might see this as a cue to sell or avoid buying.
20 EMA (Exponential Moving Average):
Above 20 EMA: If the stock price is above the 20 EMA, it suggests a potential uptrend or bullish momentum.
Below 20 EMA: If the stock price is below the 20 EMA, it indicates a potential downtrend or bearish momentum.
Trendline: A trendline is a straight line drawn on a chart to represent the general direction of a data point set.
Uptrend Line: Drawn by connecting the lows in an upward trend. Indicates that the price is moving higher over time. Acts as a support level, where prices tend to bounce upward.
Downtrend Line: Drawn by connecting the highs in a downward trend. Indicates that the price is moving lower over time. It acts as a resistance level, where prices tend to drop.
RSI: RSI readings greater than the 70 level are overbought territory, and RSI readings lower than the 30 level are considered oversold territory.
Combining RSI with Support and Resistance:
Support Level: This is a price level where a stock tends to find buying interest, preventing it from falling further. If RSI is showing an oversold condition (below 30) and the price is near or at a strong support level, it could be a good buy signal.
Resistance Level: This is a price level where a stock tends to find selling interest, preventing it from rising further. If RSI is showing an overbought condition (above 70) and the price is near or at a strong resistance level, it could be a signal to sell or short the asset.
Disclaimer:
I am not a SEBI registered. The information provided here is for learning purposes only and should not be interpreted as financial advice. Consider the broader market context and consult with a qualified financial advisor before making investment decisions.
Triangle pattern on TORNTPHARMTORNTPHARM formed a triangle pattern on daily chart with multiple test of support and resistance. Price broke out of resistance and subsequently retesting now support (previous resistance line). Looking at the aggressive bears once brought the price down compared with recent swing low, it appears bears aggressiveness has weekend. Also the recent swing high shows bulls are aggressive. Wait for the price to bounce back from support before entering long. Stop loss can be held just below recent swing low. with Target the larger width of triangle. This would be a low risk trade with potential 1:3 risk reward.
Hope you liked this idea. If so please boost this idea so others can benefit from it or leave a comment below on your thoughts on this setup. I'll be glad to hear from you. Otherwise, happy trading :-)
Torrent Pharma - Sell below 2546Hello All,
The recommendations are purely for educational purpose only, consult you financial advisor before trading.
Targets are mentioned in charts (either red lines or balck lines), keep Stop Loss as per your risk..
If you like my Idea, Don't forget to Boost and comment on my Analysis..
Have a profitable year ahead
Gautam Khanna
Technical Analyst by Passion :-)
TORRENR PHARMA READY FOR AN UP MOVE??Torrent pharma can give a nice up move as it is sustaining in the zone and tested both support and resistance several times and made them weak and usually can break through either side but in here price action is showing clear up move with a small STOPLOSS
ENTRY - 2620
STOPLOSS - 2580
TARGET - 2790, 2800++
Note- if any trade or value that's gone from the marked levels then that's not our trade just let it go or wait for it to come back
I'm not sebi registered this is my personal view
Please like or boost my idea if you like it or traded it
Double Bottom Found in TorentPharmaDouble bottom pattern fount in TorntPharma. Buy only if once price the head. sl is neckline.
target price difference between head and neckline from the entry price.
Don't Wait for the Target.Once you are in profit zone put trailing sl.Trade your own Risk. Education Purpose Only. Good Luck all
Unlocking Profit Potential: TORNTPHARM Analysis 🚀In the thrilling world of trading, decoding charts can be as exciting as a rollercoaster ride. Buckle up, we're about to unravel the secrets of TORNTPHARM.
📊 Current Positioning of TORNTPHARM
Currently, TORNTPHARM is perched near the 75-minute zone (LTF). On the intermediate timeframe (ITF), it basks in the daily demand zone, close to the daily 20EMA, with an upward trend. Zooming out to the higher timeframe (HTF), the weekly chart reveals it's in a weekly demand zone after reaching all-time highs.
The 75-minute demand zone is of the RBR type – Rally Base Rally. Plan your entry just above this zone, set the stop loss below, and target the 75-minute supply zone. The risk-to-reward ratio is an impressive 1:5.
🔍 Interpreting the Time Frames
LTF (Lower Time Frame): Timeframe for executing trades.
ITF (Intermediate Time Frame): Where we identify the overall trend.
HTF (Higher Time Frame): Timeframe for location analysis.
Lastly, remember, this analysis is for educational purposes only, and I am not a SEBI registered analyst


