TRENT Tumbles! Short Trade Hits First 2 Targets – More Downside?TRENT has exhibited strong bearish momentum since the short entry at 8161.30 on 15th October at 9:45 AM, successfully reaching Take Profit 1 (TP1) and Take Profit 2 (TP2).
Key Levels
Entry: 8161.30 – The short position was initiated as the price broke below this level, indicating a bearish trend.
Stop-Loss (SL): 8253.15 – Placed above recent resistance to protect against a potential price reversal.
Take Profit 1 (TP1): 8047.75 – The first target was reached, confirming the initial strength of the downtrend.
Take Profit 2 (TP2): 7864.00 – Continued selling pressure led to this target being achieved.
Take Profit 3 (TP3): 7680.30 – The next target in sight if the bearish trend persists.
Take Profit 4 (TP4): 7566.75 – The ultimate target, suggesting a significant downward move.
Trend Analysis
The price is trading below the Risological Dotted trendline, indicating a strong bearish trend. The sustained downward movement suggests further downside potential, with TP3 likely to be reached if the current momentum holds.
The short trade on TRENT is performing well, with TP1 and TP2 already achieved. With bearish momentum intact, the next targets at 7680.30 and 7566.75 could be within reach.
TRENT trade ideas

Trent intraday overview not created as discussedIn my yesterdays post I shared my bullish overview in TRENT because it was performing well as compared to Nifty 50.
Yesterday one condition was if price test yesterday high and hold at resistance level then upmove will be expected in TRENT.
But today price tested yesterday high but not holded at resistance level and created a good retracement.
Till 10am to 10:30am price was at yesterday high and created a retracement of 3 red candles with very low volume, So from here i was looking to enter in the trade but ther candle of 11:15 was not shown any strength and was indecisive (i was expecting healthy green candle with volume).
next candle breaked its low with volume confirmed me that today price is not going to test resistance today, so i decided not to trade in TRENT.

TRENT BUY @ strong performance In @ 8230 (Oct 9,2024)
Strong price action, ATH breakout and fundamental. Will exit it it goes -8% SL.
My target is +16% min and then buy more if it's performing 🎭 🤞
Always respect your SL🙏.

TRENT Intraday Position Update (15m Time Frame)TRENT Intraday Position Update (15m Time Frame)
We secured a solid entry at 7535.35 after the price crossed over the Risological dotted trendline. The price has successfully reached Target 1 (7698.10) and Target 2 (7961.45), maintaining strong momentum to hit the remaining targets.
Target Points:
TP 3: 8224.80
TP 4: 8387.55
Stop Loss (SL): 7403.65
The trend remains bullish, and we'll continue to monitor the position closely.

Short term trading in TrentToday Trent gave a breakout with good volume in daily time frame.
Short term trading can be done with below targets and SL-
Targets - 8124, 8227, 8402
SL - 7881
Entry range - 7964-8050

Sell Trent great sell signal trent with 7800 stoploss spot . already overbought and technically seen good sell and its consoladating also hence great opportunity

TRENT S/R Support and Resistance Levels:
Support Levels: These are price points (green line/shade) where a downward trend may be halted due to a concentration of buying interest. Imagine them as a safety net where buyers step in, preventing further decline.
Resistance Levels: Conversely, resistance levels (red line/shade) are where upward trends might stall due to increased selling interest. They act like a ceiling where sellers come in to push prices down.
Breakouts:
Bullish Breakout: When the price moves above resistance, it often indicates strong buying interest and the potential for a continued uptrend. Traders may view this as a signal to buy or hold.
Bearish Breakout: When the price falls below support, it can signal strong selling interest and the potential for a continued downtrend. Traders might see this as a cue to sell or avoid buying.
20 EMA (Exponential Moving Average):
Above 20 EMA: If the stock price is above the 20 EMA, it suggests a potential uptrend or bullish momentum.
Below 20 EMA: If the stock price is below the 20 EMA, it indicates a potential downtrend or bearish momentum.
Trendline: A trendline is a straight line drawn on a chart to represent the general direction of a data point set.
Uptrend Line: Drawn by connecting the lows in an upward trend. Indicates that the price is moving higher over time. Acts as a support level, where prices tend to bounce upward.
Downtrend Line: Drawn by connecting the highs in a downward trend. Indicates that the price is moving lower over time. It acts as a resistance level, where prices tend to drop.
RSI: RSI readings greater than the 70 level are overbought territory, and RSI readings lower than the 30 level are considered oversold territory.
Combining RSI with Support and Resistance:
Support Level: This is a price level where a stock tends to find buying interest, preventing it from falling further. If RSI is showing an oversold condition (below 30) and the price is near or at a strong support level, it could be a good buy signal.
Resistance Level: This is a price level where a stock tends to find selling interest, preventing it from rising further. If RSI is showing an overbought condition (above 70) and the price is near or at a strong resistance level, it could be a signal to sell or short the asset.
Disclaimer:
I am not a SEBI registered. The information provided here is for learning purposes only and should not be interpreted as financial advice. Consider the broader market context and consult with a qualified financial advisor before making investment decisions.

Trent Ltd view for Intraday 20th September #TRENT Trent Ltd view for Intraday 20th September #TRENT
Buying may witness above 7360
Support area 7280. Below ignoring buying momentum for intraday
Selling may witness below 7280
Resistance area 7360
Above ignoring selling momentum for intraday
Charts for Educational purposes only.
Please follow strict stop loss and risk reward if you follow the level.
Thanks,
V Trade Point

ATH breakout Good volume buildup in daily and weekly timeframe.
Price has always respected 50ema in daily time frame wait for retest ai ATH zone of retracement at 50ema.
Fundamental's are good.
Profit up QOQ.
FII stakes increased.
Trent is mainly textile part of TATA SON'S.
Assumption➡️ Bangladesh democracy meltdown in terms effecting the textile hub that it is and it might help other textile country hubs.
NOTE: I do my analysis, do your before trade.

Trent preparing for his super performance in upcoming contractOne of my favourite bullish patterns - Hidden Bullish Divergence 📈
I am studying Trent for August Futures series if it holds the support for this whole week
Final stoploss would be - 5100 WCLB
Price Movement: Trent Ltd. has shown a positive movement with the stock closing at 5,263.80, up by 53.60 (+1.03%) from its previous close. The stock reached a high of 5,310.25 and a low of 4,955.65 during the day.
Volume: The volume for the day was 763.626K, with an average volume of 598.147K, indicating higher trading activity compared to the average.
Moving Averages:
20-day EMA: 5,391.74
50-day EMA: 5,111.77
The stock is trading below its 20-day EMA but above its 50-day EMA. This suggests that while there has been a recent dip, the longer-term trend remains positive.
Support and Resistance Levels:
Immediate Support: 5,112.29 (close to the 50-day EMA)
Immediate Resistance: 5,391.78 (close to the 20-day EMA)
Chart Patterns: The stock has shown a consistent uptrend over the past few months, with occasional corrections. The recent pullback towards the 50-day EMA could be a healthy correction, providing a potential buying opportunity if the stock bounces back from the support level.
Summary
Current Trend: Uptrend with recent correction.
Key Levels: Watch for a bounce back from the 50-day EMA around 5,112.29, and resistance around the 20-day EMA at 5,391.78.
Indicators to Monitor: RSI and MACD for buy/sell signals.
Disclaimer: This analysis is not financial advice and is provided for educational purposes only. Please consult with a financial advisor before making any investment decisions.

Cup N Handle BreakoutTrent is breaking out of the cup and handle pattern after a four weeks of consolidation. As a stock forming this pattern tests old highs, it is likely to incur selling pressure from investors who previously bought at those levels; selling pressure is likely to make price consolidate with a tendency toward a downtrend trend for a period of four days to four weeks, before advancing higher. A cup and handle is considered a bullish continuation pattern and is used to identify buying opportunities.
Entry: 4700
Stoploss: 4600
Targets: 5000 / 5050.

Buy Trent Limited Short Term Trading Advice by Goodluck Capital
Buy Trent Limited
Buy Range- 4800 - 4900
Target- 5200 - 5300
StopLoss- below 4475
Potential Return- 7-9%
Approx trade duration 12 - 14 days

Trent Ltd10/06/2024
Trent Ltd
CMP:4969.45
Wait to retest 4680 - 4500
Information is only for study purpose

Trent for Positional BuyTrent for Positional Buy :
Targets : 2321.75, 2751.75 & 3466.90
SL : 1945.25
Please consult your financial advisor before investing
All research is for educational purposes only.

TRENT has a pennant pattern for an upward momentum upto 10%TRENT has been seen on a pennant chart pattern and is on the verge of a good breakout on daily TF after almost a consolidation of almost 2 months.
The company has increased institutional investing, a good 50% and above increase in sales QoQ growth for the last 3 quarters and EPS growth of 40% to 100% in the last quarter.
Good for swing traders. Can hold for about 10-15 days.
Entry - INR 4080 (Kept in WL, will wait for breakout with good volume.)
SL - (Swing Low) - 5%
TSL - According to your risk profile post 10%
Disclaimer: Please be advised that the information provided is not intended as financial advice. It is imperative to conduct thorough research before making any investment or trading decisions.

Volume deficit breakout predicts down move in TrentDue to low volume high on 22nd Apr'24 compared to previous voume at this price, chances are the price will not move further high.
This is further confirmed by higher price on low volume on 25&26 Apr'24


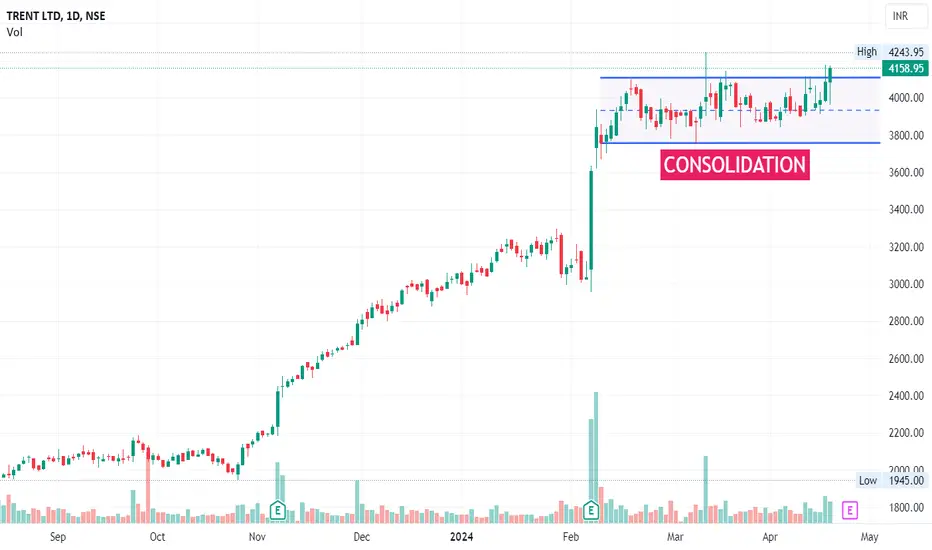
TRENT(D)TRENT consolidating near its high levels. Traders monitoring for potential breakout from this consolidation pattern. 📈

Keep An Eye - Consolidation Breakout - TRENT 📊 Script: TRENT
📊 Sector: Retail
📊 Industry: Trading
Key highlights: 💡⚡
📈 Script is giving breakout of Consolidation Zone we may see good rally till 4243.
📈 One can go for Swing Trade.
⏱️ C.M.P 📑💰- 4158
🟢 Target 🎯🏆 - 4243
⚠️ Important: Always maintain your Risk & Reward Ratio.
✅Like and follow to never miss a new idea!✅
Disclaimer: I am not SEBI Registered Advisor. My posts are purely for training and educational purposes.
Eat🍜 Sleep😴 TradingView📈 Repeat 🔁
Happy learning with trading. Cheers!🥂
"Eyeing Trent stock 📈: Set your sights with a stop loss at 3900Investors eyeing Trent stock may consider a strategic approach with a stop-loss set at 3900 and a target price of 4300. This approach aims to manage risk by limiting potential losses while targeting a specific price level for profit-taking. The stop-loss serves as a safety net, protecting against adverse market movements, while the target price provides a clear objective for capitalizing on the stock's upward momentum.


Trying Candlestick's Patterns !If you do find mistakes please do let me know so I will improve,
But I see Uptrend Then Shooting Star and then Confirmation Candle Bearish Engulfing .
Continuation of trend and Inside bar And Follow Up , Then Morning Star.
Gratify if you appreciate the practice then you can like it, share it and
If you want me to investigate any chart for you then would cherish doing that for you.
Thank you for your time and support.
Stay safe.

Rising Wedge breakdown in TRENTTRENT LTD
Key highlights: 💡⚡
✅On 1Hour Time Frame Stock Showing Breakdown of Rising Wedge Pattern .
✅ Strong bearish Candlestick Form on this timeframe.
✅It can give movement up to the Breakdown target of 2017-.
✅Can Go short in this stock by placing a stop loss above 2115+.
