Next report date
—
Report period
—
EPS estimate
—
Revenue estimate
—
10.05 INR
2.43 B INR
56.89 B INR
73.16 M
About TRIVENI ENGG. & INDS. LTD
Sector
Industry
Website
Headquarters
Noida
Founded
1932
ISIN
INE256C01024
FIGI
BBG000C3YSP3
Triveni Engineering & Industries Ltd. engages in the manufacture of sugar and engineered mechanical equipment, steam turbines, and high speed gears. It operates through the following business segments: Sugar, Engineering, and Others. The Sugar segment involves in the manufacture of white crystal sugar and offers co-generation, and distillery. The Engineering segment focuses on high speed and niche low speed products, and supply of new equipment as well as providing replacement solutions for power sector. The company was founded on July 27, 1932 and is headquartered in Noida, India.
Related stocks
#TRIVENI Date: 22-05-2025
Current Price: 423.40
Mid-Point: 423.48
Upside Targets: 435.73, 441.38, 448.09 and 454.80
Downside Targets: 411.24, 405.58, 398.86 and 392.15
Support: 416.91
Resistance: 430.09
#TRIVENI

Triveni LongTriveni Looks to be Long if cross above 514. Moving in the same channel since April. So almost 9 months in the range..

TRIVENI ENGG. & INDS LTD S/RSupport and Resistance Levels:
Support Levels: These are price points (green line/shade) where a downward trend may be halted due to a concentration of buying interest. Imagine them as a safety net where buyers step in, preventing further decline.
Resistance Levels: Conversely, resistance levels (re

Triveni Engineering - Positional Trade Idea Triveni Engineering - Positional Trade Idea 🚀
📈 Breakout Retest Opportunity
Triveni Engineering is showing strong bullish momentum as it reclaims key resistance levels near ₹485 on the weekly chart, supported by increasing volume.
Entry Zone: ₹485-490
Target 1: ₹540
Target 2: ₹600
Stop-loss: ₹450

TRIVENI: Abki Baar 500 Paarr??🎯 The chart is self-explanatory as always.
🎯 Breakout of a beautiful contraction pattern
🎯 Price sustains the breakout price point with Dojis
🎯 A huge green momentum candle with good volume seals it up
🎯 I like this price structure
⚠️Disclaimer: We are not registered advisors. The views expressed h

Multiple Indicator - TRIVENI📊 Script: TRIVENI
📊 Sector: Sugar
📊 Industry: Sugar
Key highlights: 💡⚡
📈 Script is trading at upper band of BB and giving breakout of it.
📈 MACD is giving crossover .
📈 Double Moving Averages are giving crossover.
📈 Right now RSI is around 71.
📈 One can go for Swing Trade.
⏱️ C.M.P 📑💰- 426
🟢 Ta

Golden Crossover - TRIVENI📊 Script: TRIVENI
📊 Sector: Sugar
📊 Industry: Sugar
Key highlights: 💡⚡
📈 Golden Crossovers are seen into this Script.
📈 Golden Crossover is where slow moving average line crosses fast moving average above.
📈 Although Script is trading at All Time High we may see some bullish rally.
⏱️ C.M.P 📑💰-

TRIVENI ENGINEERING - STRONG TECHNICALLYTRIVENI ENGINEERING
The stock has a good history of technical breakouts making it to go up almost 300% twice and now being currently in the rise, there is good opportunity right now as it's being alongside at the support and breaking out of a channel consolidation too presenting a favorable entry w

Strong Buy TRIVENI ENGINEERIN Target 411.Buy zone 320-330The 4 analysts offering 1 year price forecasts for TRIVENI ENGINEERIN have a max estimate 479.00 , min estimate of 340.00 and a average estimate of 411.00.Buy zone 320-330
Be warned: -
This info isn’t a recommendation for what you should personally do, so please don’t take the data as investment ad

See all ideas
Summarizing what the indicators are suggesting.
Neutral
SellBuy
Strong sellStrong buy
Strong sellSellNeutralBuyStrong buy
Neutral
SellBuy
Strong sellStrong buy
Strong sellSellNeutralBuyStrong buy
Neutral
SellBuy
Strong sellStrong buy
Strong sellSellNeutralBuyStrong buy
An aggregate view of professional's ratings.
Neutral
SellBuy
Strong sellStrong buy
Strong sellSellNeutralBuyStrong buy
Neutral
SellBuy
Strong sellStrong buy
Strong sellSellNeutralBuyStrong buy
Neutral
SellBuy
Strong sellStrong buy
Strong sellSellNeutralBuyStrong buy
Displays a symbol's price movements over previous years to identify recurring trends.
Frequently Asked Questions
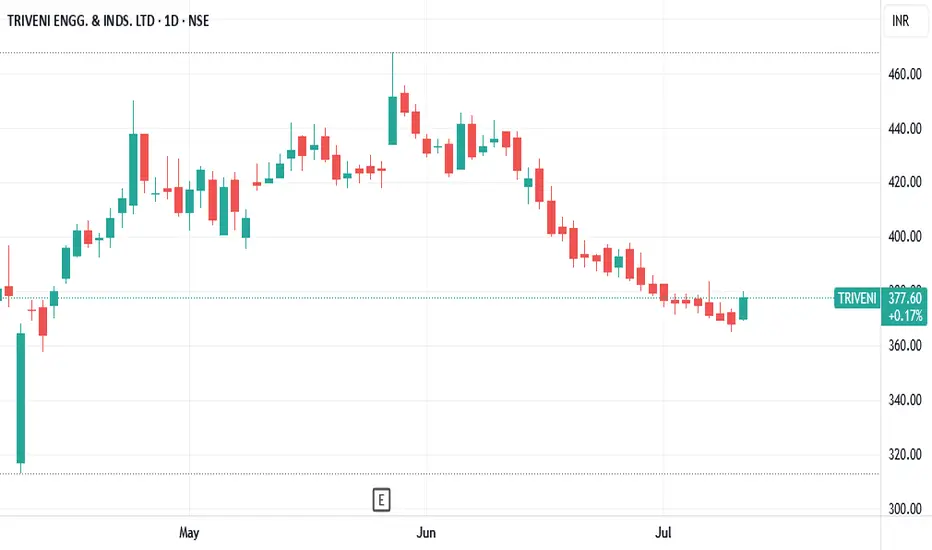
The current price of TRIVENI is 340.80 INR — it has decreased by −0.89% in the past 24 hours. Watch TRIVENI ENGG. & INDS. LTD stock price performance more closely on the chart.
Depending on the exchange, the stock ticker may vary. For instance, on NSE exchange TRIVENI ENGG. & INDS. LTD stocks are traded under the ticker TRIVENI.
TRIVENI stock has fallen by −8.57% compared to the previous week, the month change is a −9.58% fall, over the last year TRIVENI ENGG. & INDS. LTD has showed a −19.98% decrease.
We've gathered analysts' opinions on TRIVENI ENGG. & INDS. LTD future price: according to them, TRIVENI price has a max estimate of 518.00 INR and a min estimate of 342.00 INR. Watch TRIVENI chart and read a more detailed TRIVENI ENGG. & INDS. LTD stock forecast: see what analysts think of TRIVENI ENGG. & INDS. LTD and suggest that you do with its stocks.
TRIVENI reached its all-time high on Dec 30, 2024 with the price of 536.00 INR, and its all-time low was 10.35 INR and was reached on Aug 28, 2013. View more price dynamics on TRIVENI chart.
See other stocks reaching their highest and lowest prices.
See other stocks reaching their highest and lowest prices.
TRIVENI stock is 2.17% volatile and has beta coefficient of 1.48. Track TRIVENI ENGG. & INDS. LTD stock price on the chart and check out the list of the most volatile stocks — is TRIVENI ENGG. & INDS. LTD there?
Today TRIVENI ENGG. & INDS. LTD has the market capitalization of 74.49 B, it has decreased by −1.68% over the last week.
Yes, you can track TRIVENI ENGG. & INDS. LTD financials in yearly and quarterly reports right on TradingView.
TRIVENI ENGG. & INDS. LTD is going to release the next earnings report on Nov 6, 2025. Keep track of upcoming events with our Earnings Calendar.
TRIVENI net income for the last quarter is 44.10 M INR, while the quarter before that showed 1.83 B INR of net income which accounts for −97.59% change. Track more TRIVENI ENGG. & INDS. LTD financial stats to get the full picture.
Yes, TRIVENI dividends are paid annually. The last dividend per share was 1.25 INR. As of today, Dividend Yield (TTM)% is 1.03%. Tracking TRIVENI ENGG. & INDS. LTD dividends might help you take more informed decisions.
TRIVENI ENGG. & INDS. LTD dividend yield was 0.65% in 2024, and payout ratio reached 22.98%. The year before the numbers were 1.13% and 19.39% correspondingly. See high-dividend stocks and find more opportunities for your portfolio.
EBITDA measures a company's operating performance, its growth signifies an improvement in the efficiency of a company. TRIVENI ENGG. & INDS. LTD EBITDA is 4.43 B INR, and current EBITDA margin is 8.37%. See more stats in TRIVENI ENGG. & INDS. LTD financial statements.
Like other stocks, TRIVENI shares are traded on stock exchanges, e.g. Nasdaq, Nyse, Euronext, and the easiest way to buy them is through an online stock broker. To do this, you need to open an account and follow a broker's procedures, then start trading. You can trade TRIVENI ENGG. & INDS. LTD stock right from TradingView charts — choose your broker and connect to your account.
Investing in stocks requires a comprehensive research: you should carefully study all the available data, e.g. company's financials, related news, and its technical analysis. So TRIVENI ENGG. & INDS. LTD technincal analysis shows the sell today, and its 1 week rating is sell. Since market conditions are prone to changes, it's worth looking a bit further into the future — according to the 1 month rating TRIVENI ENGG. & INDS. LTD stock shows the neutral signal. See more of TRIVENI ENGG. & INDS. LTD technicals for a more comprehensive analysis.
If you're still not sure, try looking for inspiration in our curated watchlists.
If you're still not sure, try looking for inspiration in our curated watchlists.