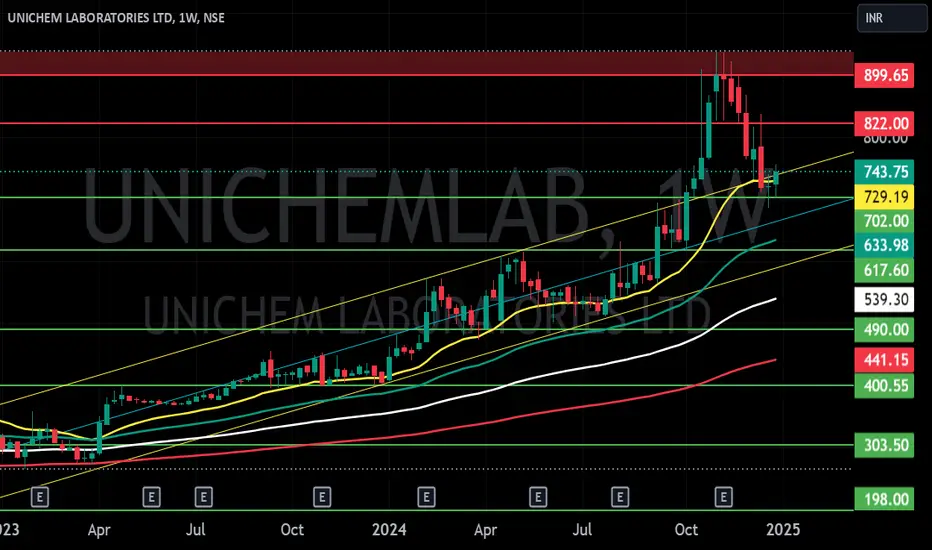
UNICHEM LABORATORIES LTD S/RSupport and Resistance Levels:
Support Levels: These are price points (green line/shade) where a downward trend may be halted due to a concentration of buying interest. Imagine them as a safety net where buyers step in, preventing further decline.
Resistance Levels: Conversely, resistance levels (red line/shade) are where upward trends might stall due to increased selling interest. They act like a ceiling where sellers come in to push prices down.
Breakouts:
Bullish Breakout: When the price moves above resistance, it often indicates strong buying interest and the potential for a continued uptrend. Traders may view this as a signal to buy or hold.
Bearish Breakout: When the price falls below support, it can signal strong selling interest and the potential for a continued downtrend. Traders might see this as a cue to sell or avoid buying.
MA Ribbon (EMA 20, EMA 50, EMA 100, EMA 200) :
Above EMA: If the stock price is above the EMA, it suggests a potential uptrend or bullish momentum.
Below EMA: If the stock price is below the EMA, it indicates a potential downtrend or bearish momentum.
Trendline: A trendline is a straight line drawn on a chart to represent the general direction of a data point set.
Uptrend Line: Drawn by connecting the lows in an upward trend. Indicates that the price is moving higher over time. Acts as a support level, where prices tend to bounce upward.
Downtrend Line: Drawn by connecting the highs in a downward trend. Indicates that the price is moving lower over time. It acts as a resistance level, where prices tend to drop.
Disclaimer:
I am not a SEBI registered. The information provided here is for learning purposes only and should not be interpreted as financial advice. Consider the broader market context and consult with a qualified financial advisor before making investment decisions.
UNICHEMLAB trade ideas
UNICHEMLABDisclaimer :
This is not financial advice. Please do your own research or consult with a financial advisor before making any investment decisions. Investments in stocks can be risky and may result in loss of capital.

Unichem Laboratories Ltd view for Intraday 18th Nov #UNICHEMLAB Unichem Laboratories Ltd view for Intraday 18th Nov #UNICHEMLAB
Resistance 900. Watching above 902 for upside movement...
Support area 885. Below 890 ignoring upside momentum for intraday
Support 885 Watching below 884 for downside movement...
Resistance area 900
Above 890 ignoring downside move for intraday
Charts for Educational purposes only.
Please follow strict stop loss and risk reward if you follow the level.
Thanks,
V Trade Point

UNICHEMLAB bought @ 735 in @ 735 (14-oct-2024)
Reason: expecting good results as also price is showing the uptrend, ATH, Strong RSI and volume.
Exit: SL with -8%
Buy more : if stock goes beyond 15%
Always respect your SL


Unichem Labs
Loss making company turning profitable in the last quarter with both promoters ,FII/DIIs increasing their stake
Also, given a long term Gann level breakout
Very good RR WITH SL @ 550

UNICHEMLAB VCP Pattern - Weekly chartUnichem Laboratories Ltd
NSE: UNICHEMLAB
A long VCP pattern is about to play in UNICHEMLAB.
Prior Breakout gave a sharp sell off which was absorbed and gave a decent immediate upmove with high volumes.
Contraction at the juncture; a strong close above 400 is a good buy with 270 as Stop and 680 as target.


buy unichemunichemlab has retest it breakout level. we may stock can rise till 360 till the time it holds 293 clbs

Unichem breakout buy unichemlab
sector pharma
sector- bullish yes
consolidation- done 5 months
breakout - done yes
200 ema-rising 30
RS - strong yes
volume- heavy c
bo level 273
buy level 275
buy date 6.10.20
bo day close 273


unichem--resistance zoneweekly chart suggest that we are in a strong resistance zone and share may take some time here and buy on dip near to 180 level or hold it with a stop of 177 for a target 216, 226 , 280 level

unichem buy in channel with sapport near to 180 and target of 210 to 218 and probably third wave to end near to that zone buy with a stop of 178.long term target of 250 to 260 for 5 th wave

Getting ready to Go loco after 211 ...Lower time frame on the 4hr looks like 177 is the recently established support , lets see how this develops may just get a chance to pick up on the touch of the short term uptrend line or test of the 200 day .
Would rather buy the flip of 196 than hop on now since it may take a few days and might give a better opportunity to buy lower .

US approval ! send it to 269?Quick look need the 200 day to be tested before we carry on the daily , however on the weekly the 99 day has been tested and 228 looks up next .
Going to keep an eye on this at present trying to flip 196 area into support.
Again this a Covid trade so shall enter if its appealing and comes anywhere near 165 since this should be front run or buy on the retest of 196.
Down trend since 2018 was broken a few weeks ago and tested so this i feel is going to carry on till at least till 269 once we cross this key level of 196. Which once broken this baby should fly .
Stop loss 159.65
shall post a LTF next lets see how likely to get the 163 remember sell the news so may get a opportunity.

