UPL , 1W , Weekly Bullish As the UPL pattern is looking very Good and Giving Breakout and Enter only after the Close of Weekly time frame .
follow your risk Management , proper Position Sizing
UPL trade ideas

UPL for short term target around 617.45UPL Is in downside journey and may be it will fall more for monday 27 may 25 it may touch 617, hope it will touch it , lets see what happens

Market Outlook and Entry Strategy for UPLBased on the daily chart structure, the current market trend is bullish, evidenced by a Break of Structure (BOS). The price has already retraced to the 70% Fibonacci level on the same timeframe, indicating a healthy pullback within the ongoing trend.
However, despite this bullish context, this is not yet an ideal high-probability entry for either swing or short-term positional trading. The reason is that there remains an unmitigated Fair Value Gap (FVG) located near an extreme order block. This inefficiency could draw price lower before a continuation move.
Recommended Strategy:
Wait for price to revisit the order block that aligns with the FVG.
Upon reaching this zone, look for confirmation via:
A Change of Character (CHoCH) or
A Flip zone formation on a lower timeframe.
Entry Confirmation:
For swing trading, monitor the 15-minute timeframe for a CHoCH or flip as confirmation.
For short-term positional entries, use the 1-hour timeframe to confirm a reversal or structure shift.
Once confirmation is observed at the order block zone, this will provide a high-probability entry aligned with the prevailing bullish trend and refined institutional order flow concepts.

Reverse Head &Shoulder Pattern in UPL & breakout from 200DMAUPL formed Reverse H&S Pattern & given breakout from 560 level .It's a reversal pattern. Target will be arround 700 level & stoploss will be near about 570.UPL also cross its 200 DMA after almost 1.5y

UPL Positional ideaStan Weinstein framework
a)2 yrs consolidation,
b)increasing 40 WEMA
c) strong sector,
d) increased QPAT
Entry: Only BO with High volume will trigger
Exit: trailing with 40 EMA or swing high
whichever will be higher


UPL Hourly looking goodUPL on the Hourly time frame is setting up nicely.
Expecting breakout above 660 level or we get to see breakdown below 650 level
Alert in place to trade whatever we get
On the long side when triggered, expecting to see 670/680/700
If short triggers then expecting 640/635

UPL 1W UPL is looking Very Good and Forming The Pattern , it is repeating the same pattern from the History ,
U can Take up the Trade when the Upper Trendline of UPL is broken , Nifty is also looking Bullish from Today . Take UPL trade when it is Broken and Be Caution at Upper Trendline . Enter after Good Confirmation Candle only
Take the Trade with Minimum Risk and Maximum Reward . This is not a call , Make your Analysis first and risk according to your Capacity .

uplUPL numbers beat our estimates across the board. Revenue beat (+2.8%) due to strong volume and price growth, EBITDA beat due to lower-than-expected employee expenses, and Adj. PAT beat was due to reduced interest cost and one-time tax benefit. We increase our FY26E and FY27E estimates by 1.5% and 7.2% to INR 49.9 and INR 61.3, respectively showing our confidence that strong volume growth coupled with stable pricing trends, and reduction in interest cost from rights issue and Advanta stake sale. With normalized inventory levels across major markets the company is well-positioned to sustain the growth momentum.

Review and plan for 10th February 2025Nifty future and banknifty future analysis and intraday plan.
Few stocks too.
This video is for information/education purpose only. you are 100% responsible for any actions you take by reading/viewing this post.
please consult your financial advisor before taking any action.
----Vinaykumar hiremath, CMT

UPL - Broadening bottom📈 UPL - Bullish Setup! 🚀
🔹 Current Price: ₹548
🔹 Target: ₹710
🔹 Expected Time: Oct 2025
The stock shows a strong broadening bottom pattern, suggesting potential upside. A steady move towards the target is expected with time. Hold on for the ride! 💹 #StockMarket #UPL #Target710

UPL Long Term TargetUPL Long Term Target : available at 1:4 Riska Reward Ratio for Long term investors.
At very cruicial monthly support line

UPL : What price action telling us?UPL Ltd –
Analysis:
Wave Structure & Retracement Zone: The price action shows a breakdown of the previous trendline support, followed by a failed Change of Character (ChoCH), indicating potential reversal dynamics. The stock bounced back strongly from the deep retracement zone (127% Fibonacci extension) near 471.55 INR, which also aligns with a key demand zone.
Buying Range: The stock is trading within the highlighted buying range of 550-540 INR, which represents a potential accumulation zone.
Target Zone: The first target zone is marked at 640-657 INR, which aligns with historical resistance levels.
Stop Loss: A strict stop loss is set at 517.80 INR, below the demand zone and deep retracement level, as indicated on the chart.
Trading Plan:
Action: Place buy orders within the 550-540 INR range. Accumulate positions cautiously within this buying zone.
Stop Loss: Place a daily closing-based stop loss at 517.80 INR.
Targets:
First Target: 640 INR.
Final Target: 657 INR.
Reasoning:
The bounce from the deep retracement zone signals strong demand and potential institutional buying.
Failure of the earlier bearish ChoCH suggests that the stock is likely transitioning into an upward trend.
The target range aligns with previous key resistance levels, offering a favorable risk-reward ratio.

UPL Ltd. (NSE: UPL) AnalysisOverview: UPL Ltd. is currently trading at ₹545.50, showing signs of consolidation near its short-term moving averages. The price is poised at a critical level with a potential for either a breakout or a breakdown, depending on market dynamics and volume activity.
Technical Insights:
1.Support and Resistance Levels:
Immediate Support: ₹528 (marked by recent lows and a strong demand zone).
Key Resistance: ₹549.50 (current level) and ₹584.05 (previous swing high and significant supply zone).
2.Volume Profile:
The visible range volume profile indicates a concentration of volume between ₹540-₹550, suggesting this zone as a pivot for future price action.
A breakout above ₹549.50 could attract higher volumes, pushing the stock towards ₹584.
3.Moving Averages:
The stock is near its 20-day and 50-day EMAs, indicating a neutral short-term trend.
A clear break above the 200-day EMA would signal a shift in momentum towards the bulls.
4.RSI (Relative Strength Index):
RSI is hovering around 50, indicating a lack of strong momentum. A breakout above resistance could drive RSI towards overbought territory, confirming bullishness.
Scenarios:
Bullish Case: A breakout above ₹549.50 with high volumes could see the stock targeting ₹584.05 in the short term. Sustained momentum may lead to further upside towards ₹600.
Bearish Case: Failure to sustain above ₹549.50 might result in a pullback to ₹528. A breakdown below ₹528 could open doors for lower levels, around ₹510.
Trading Plan:
Entry:
Bullish: Above ₹550 for targets of ₹584 and ₹600.
Bearish: Below ₹528 for targets of ₹510.
Stop-Loss:
Bullish: ₹535.
Bearish: ₹540.
Final Thoughts: UPL Ltd. is at a crucial level with a well-defined risk-reward setup. Traders should wait for confirmation of direction with strong volume support before taking positions. Monitor global agrochemical sector trends and news for potential catalysts.

UPL LTD S/R Support and Resistance Levels:
Support Levels: These are price points (green line/shade) where a downward trend may be halted due to a concentration of buying interest. Imagine them as a safety net where buyers step in, preventing further decline.
Resistance Levels: Conversely, resistance levels (red line/shade) are where upward trends might stall due to increased selling interest. They act like a ceiling where sellers come in to push prices down.
Breakouts:
Bullish Breakout: When the price moves above resistance, it often indicates strong buying interest and the potential for a continued uptrend. Traders may view this as a signal to buy or hold.
Bearish Breakout: When the price falls below support, it can signal strong selling interest and the potential for a continued downtrend. Traders might see this as a cue to sell or avoid buying.
20 EMA (Exponential Moving Average):
Above 20 EMA(50 EMA): If the stock price is above the 20 EMA, it suggests a potential uptrend or bullish momentum.
Below 20 EMA: If the stock price is below the 20 EMA, it indicates a potential downtrend or bearish momentum.
Trendline: A trendline is a straight line drawn on a chart to represent the general direction of a data point set.
Uptrend Line: Drawn by connecting the lows in an upward trend. Indicates that the price is moving higher over time. Acts as a support level, where prices tend to bounce upward.
Downtrend Line: Drawn by connecting the highs in a downward trend. Indicates that the price is moving lower over time. It acts as a resistance level, where prices tend to drop.
RSI: RSI readings greater than the 70 level are overbought territory, and RSI readings lower than the 30 level are considered oversold territory.
Combining RSI with Support and Resistance:
Support Level: This is a price level where a stock tends to find buying interest, preventing it from falling further. If RSI is showing an oversold condition (below 30) and the price is near or at a strong support level, it could be a good buy signal.
Resistance Level: This is a price level where a stock tends to find selling interest, preventing it from rising further. If RSI is showing an overbought condition (above 70) and the price is near or at a strong resistance level, it could be a signal to sell or short the asset.

upl buy for swing /positional trade
upl buy near 547
avg near at 535
sl520 5 % sl sl strictly follow
tgt 5%10%15%
hold 3-6weeks

UPL - Short learning, TIliting line and TFUPL - Short learning, TIliting line and TF
1) Timeframe lapse
2) Retest done on 1 hr time frame
3) Lets see if it could hit 533

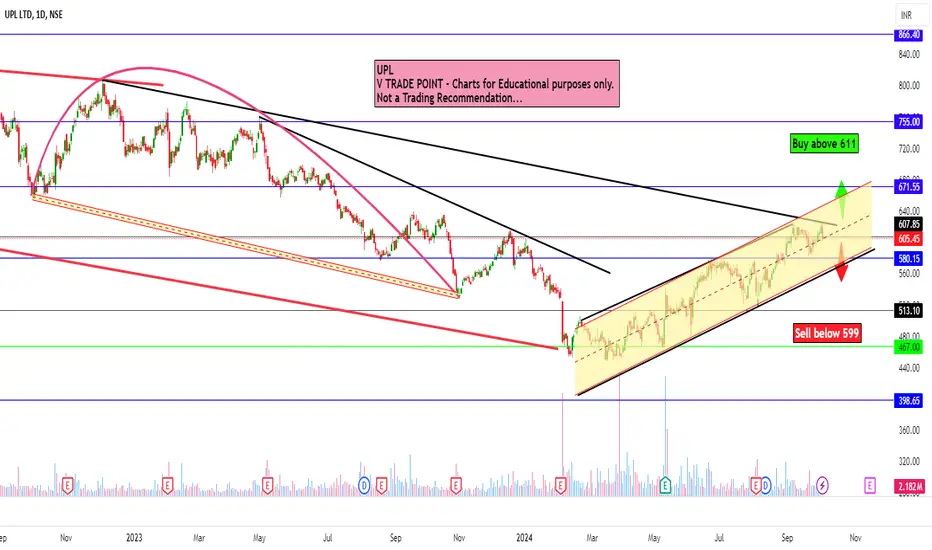
UPL Ltd view for Intraday 4th October #UPL UPL Ltd view for Intraday 4th October #UPL
Buying may witness above 611
Support area 605. Below ignoring buying momentum for intraday
Selling may witness below 599
Resistance area 605
Above ignoring selling momentum for intraday
Charts for Educational purposes only.
Please follow strict stop loss and risk reward if you follow the level.
Thanks,
V Trade Point
UPL_22.09.2024New updated chart on hourly basis, possible 570 prior to reversal.
Study purpose only.

UPL Bearish Sell sideThe stock formed bearish flag in 30 mins chart. not only this stock Adaniport and ACC also formed like this. the stock expected to go on sell side further again.


Inverse head and shoulders pattern formation in UPL Study
It looks like UPL's downfall is completed!
Date: 11 Sep 2024
Pattern: Inverse head and shoulders
Current market price 619
Pattern target 679
Disclaimer: This is my personal view, sharing it only for educational purposes. Consider it as a Paper trade. consult your financial analyst before taking any trade
