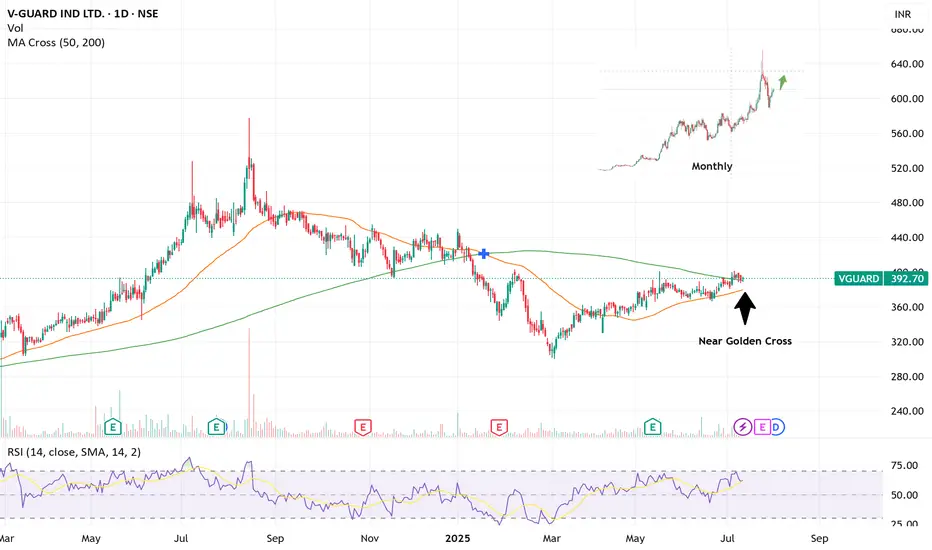
Guard you portfolio with VGUARD!- Price above 50, 200 DMA
- Nearing Golden Crossover
- Fundamentally decent stock
Only for education. This is not a buy/sell recommendation
VGUARD trade ideas
VGUARD IND LTD SWING TRADE📊 Price Action & Trend Analysis
Analyzing market trends using price action, key support/resistance levels, and candlestick patterns to identify high-probability trade setups.
Always follow the trend and manage risk wisely!
Price Action Analysis Interprets Market Movements Using Patterns And Trends On Price Charts.
👉👉👉Follow us for Live Market Views/Trades/Analysis/News Updates.

V-GUARD IND LTD S/RSupport and Resistance Levels:
Support Levels: These are price points (green line/shade) where a downward trend may be halted due to a concentration of buying interest. Imagine them as a safety net where buyers step in, preventing further decline.
Resistance Levels: Conversely, resistance levels (red line/shade) are where upward trends might stall due to increased selling interest. They act like a ceiling where sellers come in to push prices down.
Breakouts:
Bullish Breakout: When the price moves above resistance, it often indicates strong buying interest and the potential for a continued uptrend. Traders may view this as a signal to buy or hold.
Bearish Breakout: When the price falls below support, it can signal strong selling interest and the potential for a continued downtrend. Traders might see this as a cue to sell or avoid buying.
MA Ribbon (EMA 20, EMA 50, EMA 100, EMA 200) :
Above EMA: If the stock price is above the EMA, it suggests a potential uptrend or bullish momentum.
Below EMA: If the stock price is below the EMA, it indicates a potential downtrend or bearish momentum.
Trendline: A trendline is a straight line drawn on a chart to represent the general direction of a data point set.
Uptrend Line: Drawn by connecting the lows in an upward trend. Indicates that the price is moving higher over time. Acts as a support level, where prices tend to bounce upward.
Downtrend Line: Drawn by connecting the highs in a downward trend. Indicates that the price is moving lower over time. It acts as a resistance level, where prices tend to drop.
Disclaimer:
I am not a SEBI registered. The information provided here is for learning purposes only and should not be interpreted as financial advice. Consider the broader market context and consult with a qualified financial advisor before making investment decisions.

V-Guard: Good for long termV-Guard as a company has pretty good established brand in wire business.
For short term your max target should be T2, that too not much probability. For T2 your risk reward is about 1:2. Not that good trade.
The reason to publish it because I like this stock. Has good potential to move above ATH in very long. I consider this portfolio stock. Still from chart not clear signs of bottom formation, but I will small quantity and decide again if I want to add more when it reaches T1.

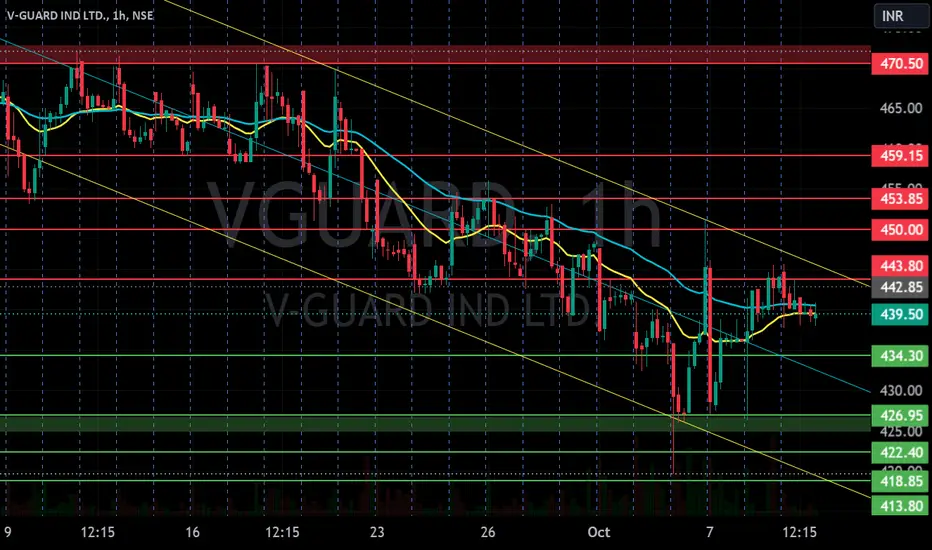
VGUARD Skyrockets, Hits All Targets in Perfect Long Trade!VGUARD Share Analysis:
VGUARD has delivered an impressive performance on the 15-minute chart, with a strong upward trend that successfully hit all marked targets. Utilizing the Risological Dotted Trendline, we identified clear momentum and a favorable entry point, paving the way for an ideal long trade.
Trade Summary:
Entry Level: 418.15
Target Levels:
TP1: 422.85 ✅
TP2: 430.50 ✅
TP3: 438.15 ✅
TP4: 442.85 ✅
Stop Loss: 414.30
Key Points:
Risological Dotted Trendline Support: The Risological dotted trendline provided consistent support, confirming bullish sentiment and guiding the stock upwards.
Smooth Momentum: VGUARD demonstrated a steady climb, offering a profitable setup for traders who capitalized on the trend.
Conclusion:
The trade exemplifies the power of combining technical indicators with a reliable trendline. Traders should watch for similar setups to maximize profit opportunities in such well-defined trends.

VGUARD S/R Support and Resistance Levels:
Support Levels: These are price points (green line/shade) where a downward trend may be halted due to a concentration of buying interest. Imagine them as a safety net where buyers step in, preventing further decline.
Resistance Levels: Conversely, resistance levels (red line/shade) are where upward trends might stall due to increased selling interest. They act like a ceiling where sellers come in to push prices down.
Breakouts:
Bullish Breakout: When the price moves above resistance, it often indicates strong buying interest and the potential for a continued uptrend. Traders may view this as a signal to buy or hold.
Bearish Breakout: When the price falls below support, it can signal strong selling interest and the potential for a continued downtrend. Traders might see this as a cue to sell or avoid buying.
20 EMA (Exponential Moving Average):
Above 20 EMA(50 EMA): If the stock price is above the 20 EMA, it suggests a potential uptrend or bullish momentum.
Below 20 EMA: If the stock price is below the 20 EMA, it indicates a potential downtrend or bearish momentum.
Trendline: A trendline is a straight line drawn on a chart to represent the general direction of a data point set.
Uptrend Line: Drawn by connecting the lows in an upward trend. Indicates that the price is moving higher over time. Acts as a support level, where prices tend to bounce upward.
Downtrend Line: Drawn by connecting the highs in a downward trend. Indicates that the price is moving lower over time. It acts as a resistance level, where prices tend to drop.
RSI: RSI readings greater than the 70 level are overbought territory, and RSI readings lower than the 30 level are considered oversold territory.
Combining RSI with Support and Resistance:
Support Level: This is a price level where a stock tends to find buying interest, preventing it from falling further. If RSI is showing an oversold condition (below 30) and the price is near or at a strong support level, it could be a good buy signal.
Resistance Level: This is a price level where a stock tends to find selling interest, preventing it from rising further. If RSI is showing an overbought condition (above 70) and the price is near or at a strong resistance level, it could be a signal to sell or short the asset.
Disclaimer:
I am not a SEBI registered. The information provided here is for learning purposes only and should not be interpreted as financial advice. Consider the broader market context and consult with a qualified financial advisor before making investment decisions.

SWING IDEA - V GUARD INDUSTRIESThe technical analysis of V-Guard Industries suggests a compelling swing buying opportunity.
The reasons are listed below :
The stock has successfully breached a significant resistance zone at 270-280, showcasing potential for an upward trend continuation.
The presence of a robust bullish engulfing candle on the weekly timeframe, coupled with the stock finding support at the 50 EMA, enhances the bullish outlook.
Following a prolonged consolidation period exceeding six years, the stock is poised for a potential breakout, indicating the likelihood of substantial price movement.
The formation of higher highs further reinforces the bullish sentiment and suggests an established uptrend.
A notable increase in trading volumes during the breakout phase supports the authenticity of the upward movement.
Target - 360 // 424
Stoploss - weekly close below 282
DISCLAIMER -
Decisions to buy, sell, hold or trade in securities, commodities and other investments involve risk and are best made based on the advice of qualified financial professionals. Any trading in securities or other investments involves a risk of substantial losses. The practice of "Day Trading" involves particularly high risks and can cause you to lose substantial sums of money. Before undertaking any trading program, you should consult a qualified financial professional. Please consider carefully whether such trading is suitable for you in light of your financial condition and ability to bear financial risks. Under no circumstances shall we be liable for any loss or damage you or anyone else incurs as a result of any trading or investment activity that you or anyone else engages in based on any information or material you receive through TradingView or our services.
@visionary.growth.insights

v greaton december 11, i posted this (not a recommendation) stock
now it gives upto 50% return in with 6-7 months
we never recommenda stock to buy or dell
we share our knowledge
Long-term will give compound returns, not short-term

V-GUARD INDUSTRIES S/RSupport and Resistance Levels: In technical analysis, support and resistance levels are significant price levels where buying or selling interest tends to be strong. They are identified based on previous price levels where the price has shown a tendency to reverse or find support.
Support levels are represented by the green line and green shade, indicating areas where buying interest may emerge to prevent further price decline.
Resistance levels are represented by the red line and red shade, indicating areas where selling pressure may arise to prevent further price increases. Traders often consider these levels as potential buying or selling opportunities.
Breakouts: Breakouts occur when the price convincingly moves above a resistance level (red shade) or below a support level (green shade). A bullish breakout above resistance suggests the potential for further price increases, while a bearish breakout below support suggests the potential for further price declines. Traders pay attention to these breakout signals as they may indicate the start of a new trend or significant price movement.
Disclosure: I am not SEBI registered. The information provided here is for learning purposes only and should not be interpreted as financial advice. It is important to consult with a qualified financial advisor before making any investment decisions. Tweets neither advice nor endorsement.


V-GuardInverted and slanted H&S breakout. Price is currently 11% above breakout level. Daily & weekly RSI around overbought levels, so it's a difficult call right now. Entry near previous swing high should be looked for after daily/weekly RSI cools off.
Disclaimer: Intended for educational purpose only and it's not a buy or sell recommendation.

V-Guard IndustriesIn the third quarter, V-Guard Industries, a company that produces electronic products in India, reported a profit that exceeded expectations. Their consolidated net profit increased by 48% to 582.4 million rupees compared to the same quarter last year, surpassing analysts' average expectation of 555.1 million rupees. The revenue from the electricals segment, which contributes 40% to the total revenue, increased by 8% to 4.73 billion rupees. This growth was supported by increased demand for products like electric water heaters and fans during the festive season, including Diwali and Christmas. The company also benefited from improved housing and infrastructure demand, as well as a strong recovery in exports, which boosted sales across all segments. V-Guard's EBITDA margin expanded to 8.7% from 6.8% in the previous year's quarter. Additionally, the company experienced double-digit revenue growth in both southern and non-southern markets.

for swing buying opportunity in VGUARD stock
slow momentum stock hold next 2-3month as per your analysis
buying level 290-305
target 320-325-335++
stop loss-280*

V-Gaurd Industries taking a guard for Positive Break outV- guard industries based in Kochi; Kerala is a multi-product company catering to the mass consumption market. The Company is engaged in manufacturing, trading and selling of a wide range of Electronics, Electrical and Consumer Durables. Over the years V-Guard has sold into domestic, industrial and agricultural electronic goods and appliances category. V-Guard operates more than 10 plants across various geographies across India manufacturing multiple categories.
V- guard industries Limited CMP is 299.90. The Negative aspects of the company are High Valuation (P.E. = 65), declining annual net profit, FIIs are decreasing stake and promoter Holding decreasing. The positive aspects of the company are Low debt, zero promoter pledge, MFs are increasing stake and improving cash from operations annual.
Entry after closing above 304. Targets in the stock will be 312 and 324. Long term targets in the stock will be 335+. Stop loss in the stock should be maintained at closing below 281.
The above information is provided for educational purpose, analysis and paper trading only. Please don't treat this as a buy or sell recommendation for the stock. We will not be responsible for any Profit or loss that may occur due to any financial decision taken based on any data provided in this message.

Header and shoulder Grand chance take advantage of the header and shoulder pattern breakout
See the what is pattern giving chance to take advantage it
No recommendation for buy or sell

$VGUARD forming ascending wedge NSE:VGUARD is showing signs of exhaustion as volume is getting dried up. a good correction in this could take this to 130's. This is the monthly view.
what do you think? add your view in comments.


Breaking Out Stock! #VGUARDBreaking Out Stock!
V-Guard Industries Ltd #VGUARD
1- Near All Time High
2- Highest Weekly Volume in 2023
3- Positive Trendline
Note: Technical Analysis is for Educational Purpose. I am not SEBI registered. Consult your financial advisor for any Investment Advice.

Resistance BreakoutPlease look into the chart for a detailed understanding.
Consider these for short-term & swing trades with 2% profit.
For BTST trades consider booking
target for 1% - 2%
Please consider these ideas for educational purpose
Comment below if you are looking for any answers

W pattern consolidation W pattern consolidation in Vguard . Need some unusual volumes in vguard .
Stay long in higher time frame

V-Guard Looks very good after forming a nice bullish pattern in weekly and given a BO yesterday
Safe entry would be today's(weekly) closing above 268 which makes the weekly candle close above bothe box and Fann levels.

V-Guard (Looks thrilled)Script name : V-Guard
Looking good for almost double from here once it cross the 280-290 mark and retest it .. will enter upon retest with supportive volumes too ..
Cmp 263
Tgt 350-450++
Sl can be placed at 220-190
Major areas market in the channel
Note: It's my personal view not any recommendation to buy or sell the particular stock.. Learn then earn and invest on your own research ..
