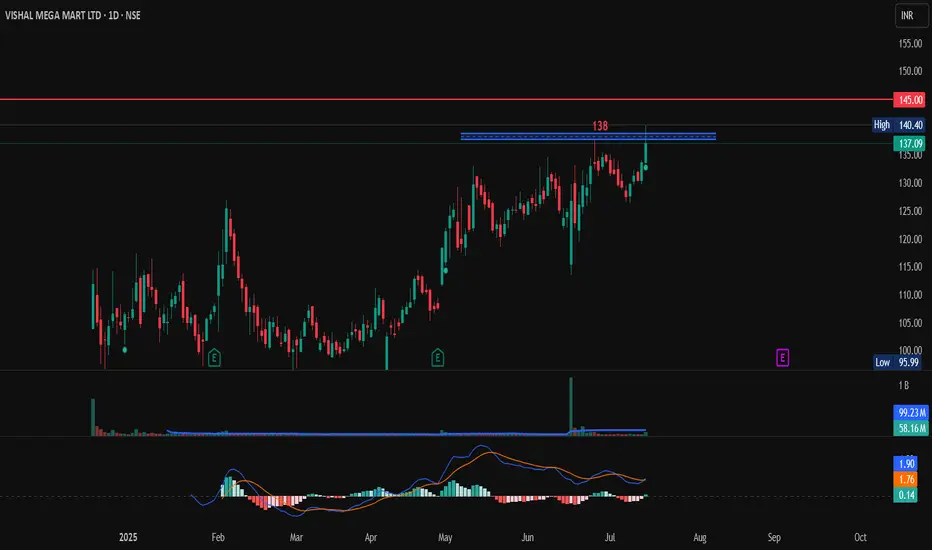
Vishal Mega Mart Long TradeVishal Mega Mart has broken it all time high of 137, but it was unable to sustain it close just below it. If is breaks the 138 mark it can easily to till 145 in next 10 sessions (2 weeks).
Enter above 138 on bullish candle pattern.
Target 145
SL 135
VMM trade ideas
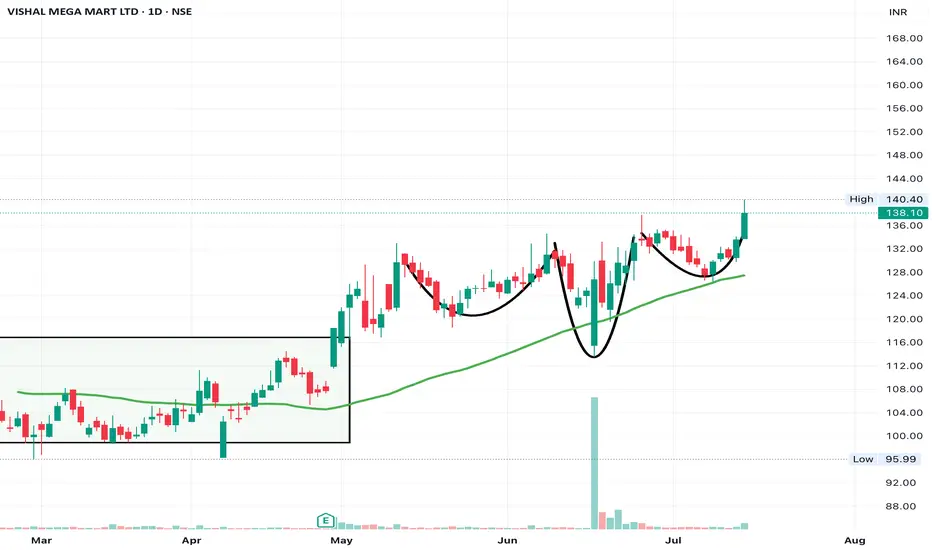
VMM - Inverse Head and Shoulder Not all charts are perfect, but in my experience, shorter the contraction duration, higher the momentum. Lets see this in action on this trade!
Breakout has happened, would love to get a close near the day high.
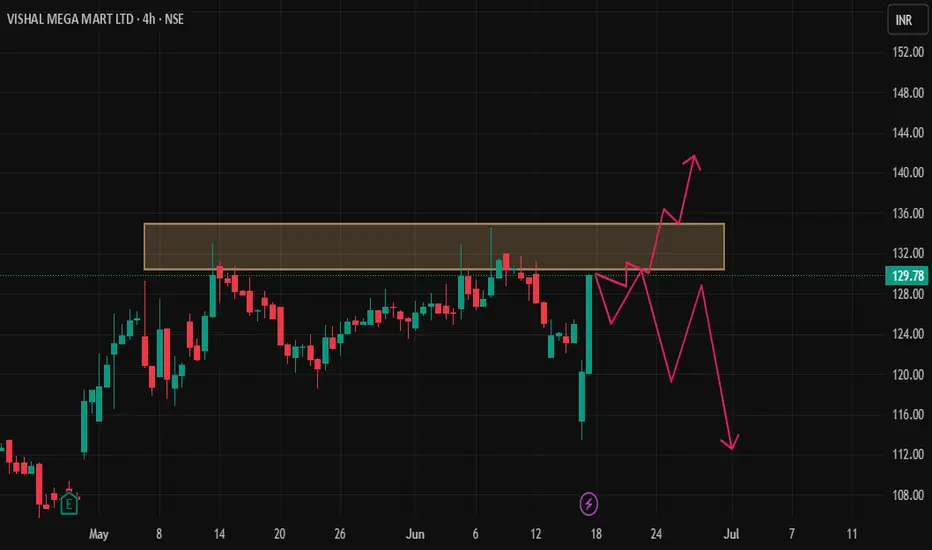
VMM Trade planFor VMM, the market is currently at a crucial zone. There are two possible scenarios: either we break the high key level and continue the bullish momentum, or we drop below the current support, triggering a bearish move. At this point, there’s no clear trade setup. We’ll wait for confirmation in either direction before taking any position to minimize risk and ensure better entry.
Go long in Vishal Mega Mart only above 108 closingVishal Mega Mart is looking good. If it closes above 108 on daily frame , then we can expect targets of 111,114, 117.50 &127.
Stoploss against this investment can be placed near 100.

little late but still good till 125 and then BOKey Observations:
Current Price Action:
The stock closed at ₹121.50 with a strong bullish candle, gaining +2.55% today.
It broke above a horizontal resistance zone around ₹114.66, now turned support.
The breakout candle is accompanied by increased volume, indicating strength and participation.
Resistance Zone:
The next immediate resistance is around ₹125.63, a previous swing high.
If the price sustains above ₹121, it could attempt to retest or break ₹125.63.
Support Zone:
The breakout level of ₹114.66 now acts as strong support.
Below that, minor support can be seen around ₹108.
Trend:
The stock was in a consolidation phase for a couple of months.
Recent higher lows and today's breakout suggest bullish momentum building up.
Volume:
Volume spikes on breakout candles generally confirm institutional interest or high conviction among traders.
What to Watch Next:
Sustained move above ₹121 could lead to a rally toward ₹125.63 or higher.
Failure to hold above ₹114.66 may invalidate the breakout, leading to a pullback.
Watch for follow-through candles and volume confirmation in the coming sessions.

VISHAL MAGA MART LTD S/R for 5/2/25Support and Resistance Levels:
Support Levels: These are price points (green line/shade) where a downward trend may be halted due to a concentration of buying interest. Imagine them as a safety net where buyers step in, preventing further decline.
Resistance Levels: Conversely, resistance levels (red line/shade) are where upward trends might stall due to increased selling interest. They act like a ceiling where sellers come in to push prices down.
Breakouts:
Bullish Breakout: When the price moves above resistance, it often indicates strong buying interest and the potential for a continued uptrend. Traders may view this as a signal to buy or hold.
Bearish Breakout: When the price falls below support, it can signal strong selling interest and the potential for a continued downtrend. Traders might see this as a cue to sell or avoid buying.
20 EMA (Exponential Moving Average):
Above 20 EMA(50 EMA): If the stock price is above the 20 EMA, it suggests a potential uptrend or bullish momentum.
Below 20 EMA: If the stock price is below the 20 EMA, it indicates a potential downtrend or bearish momentum.
Trendline: A trendline is a straight line drawn on a chart to represent the general direction of a data point set.
Uptrend Line: Drawn by connecting the lows in an upward trend. Indicates that the price is moving higher over time. Acts as a support level, where prices tend to bounce upward.
Downtrend Line: Drawn by connecting the highs in a downward trend. Indicates that the price is moving lower over time. It acts as a resistance level, where prices tend to drop.
Disclaimer:
I am not a SEBI registered. The information provided here is for learning purposes only and should not be interpreted as financial advice. Consider the broader market context and consult with a qualified financial advisor before making investment decisions.
