VOLTASNSE:VOLTAS
THIS ONE HAS A TEST TOMORROW, NEED TO SEE IF IT PASSES 645
IF YES THEN 663 COMING ON SCREENS
ELSE 638, 632 AND 625
**********************************************************************************************************************************************
Hi all,
Its pleasure to have you all here.
I have started putting these charts as a contribution from my side to all people who are new to business, as I had to struggle a lot without any sources at disposal. So please consider this a just small contribution from my side.
Few Honest Disclosures:
1. Any idea shared is my personal view, its not a recommendation, neither any kind of paid propaganda, so please
do your bit of research.
2. Ideas shared does not mean that I trade all or have position in them, this is just a helping hand to all.
3. I expect no comments or like nor any negativity, as I said its just a small helping hand from my side, please plan your risk and trade as per your capacity.
4. To trade in Cash, options or futures is your sole choice and your own risk
5. I am no expert in Tech Indicators, I believe in support resistance and trendline theory, you may use this as a supplement theory for better results.
6. I work for my own living, this is a hobby which I do sincerely to help anyone who might come across my charts.
***********************************************************************************************************************************************
VOLTAS trade ideas

VOLTAS Now With LadderHello There,
Hope You all are fine and fit..
As you all aware we are sharing daily one stock analysation report here, Same you might book profit from our analysation..
This is short evaluataion For Voltas.. As per Current chart we can say that Voltas in purely up trend and can made new high soon, If you are holding this share requesting you all do not exit this till our target points which are : 690 - 720 - 735. If you want to make new entry you can but try with limited Qty and holding mindset should be 1-2 Months. You can also check the chart as we have draw some lines of far support and resistence levels with the trend of red and green arrow lines which will help you to understand how Volatas showing trrend reversal on chart.
Hope You like our research and making good profit..
Thanks,
-UD Trade
Desclaimer : This is for educational Perpose We Are Not Sebi Registered You may ask your investment advisor before any action.


R-0114 Breakout of a rectangle pattern in VoltasTK cross over at 585 + MACD cross over + ichimoku cloud break out soggest bullish momentum. Price action in Voltas shows a breakout from a horizontal rectangle pattern on July 20 and then price shows a return move to the top end of the rectangle pattern. The pullback is on low volume suggesting low selling interest in the counter. A series of long tails in three days of trading and a green bar shows a return of buying interest in the counter. Traders may buy above Rs 598 for a rally to Rs 625 and above that to Rs 650. Keep a stop below Rs 575.


Voltas Swing Trade View...Both side view... Currently in consolidation zone once breakout with strong candle will reach target easily....

VOLTAS form Doji with NR7#VOLTAS is showing red candle since last 4 session and form the NR7 candle with doji. A Gap down opening on 27th July can show trend reversal.
Showing Mix result in Technical Parameter:
CCI is Overbought
RSI is Neutral
William %R is Neural
ROC is positive
MACD is Positive
Long cover
----------------------------------------------------------
Support : 580 and 552 and 536
Breakdown : 590
LTP : 594
Breakout : 600
Long Target : 610 and 620 and 650
----------------------------------------------------------
Positive & Negative Point:
1) Bullish in Daily/Monthly/weekly chart
----------------------------------------------------------
(Disclaimer: This is only for educational purpose and paper treading. Learn and take advice from you financial advisor)


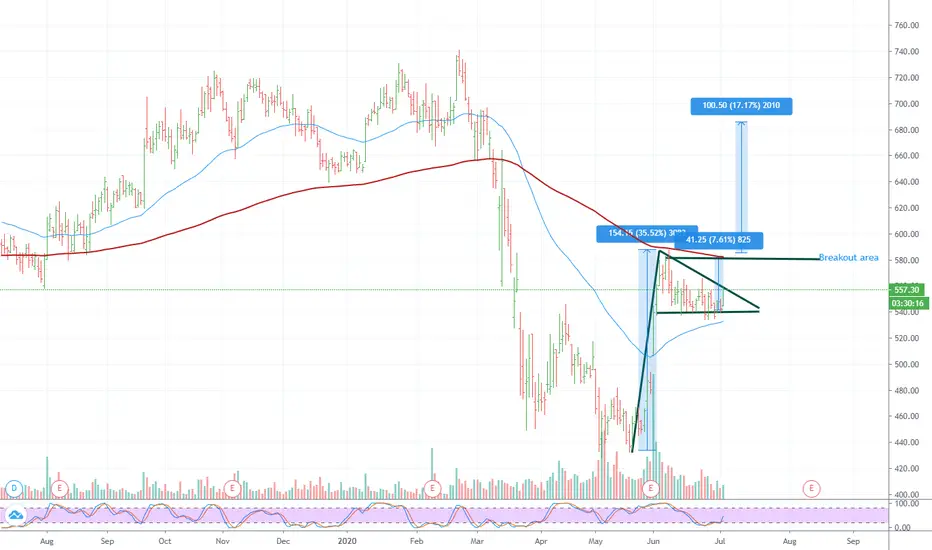
VoltasLooks interesting.
Pattern yet to breakout.
Above horizontal line should give approx 100 Rs.
Another trade is breakout above trend line can be a buy with target 580 being 200 EMA.
SL bottom horizontal line close open below.

R-0044 Short Term Cash Buy VOLTAS @564.35-567.5 SL 549 TGT 600Bullish chart pattern followed by TK cross over @543, cloud break out on the upside supported by the good volume.

Voltas Tech.Analysisvoltas support 554, 542, 535.
resistance 585, 614.
**i am not sebi registred analyst i share my view.**

[Intraday and Positional] VoltasBAMM is active. Can sell with SL at 556.5 for target 545 and then can refer the chart for long as per harmonics pattern

Voltas to possibly gain tommorowat area of value that is support
above 20 and 50 ema
low momentum on macd can be chased
upcoming crossover
short term target 575
This is for educational purpose only take your own risk
If my ideas help you earn consider supporting me :) and help me get a paid subscription on tradingview so that I can save my charts.
Thank you


VOLTAS - Bull Flag Breakout - LongNSE:VOLTAS gave a bull flag breakout. One can go long here with SL below the demand zone

VOLTAS FOR INTRADAYVOLTAS is looking good for intraday. To know about this and other stocks entry and exit have a look at Telleegraam channneell UG MARKET.
