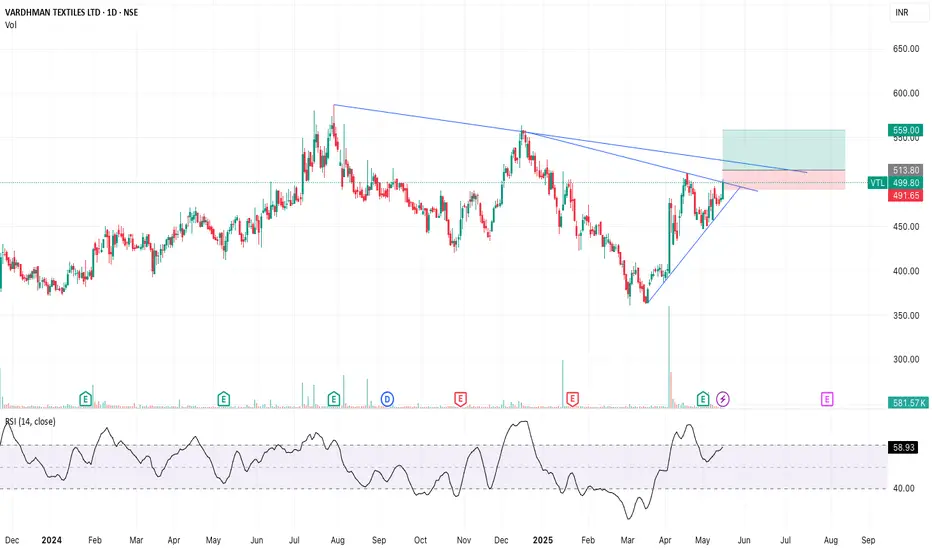
VTL In Strong uptrend for until it holds the Yellow Uptrend line. Odd chance it can break down on worst case on red down trend channel.
VTL trade ideas

VLT LongMACD, Triple MA, RSI and Volume are aligning with the long trade
Fundamentals look good too.
enter only after recent swing high BoS.
50 SMA Rising- Positional TradeDisclaimer: I am not a Sebi registered adviser.
This Idea is publish purely for educational purpose only before investing in any stocks please take advise from your financial adviser.
Its 50 SMA Rising Strategy. Suitable for Positional Trading Initial Stop loss lowest of last 2 candles and keep trailing with 50 days SMA if price close below 50 SMA then Exit or be in the trade some time trade can go for several months.
Be Discipline because discipline is the Key to Success in the STOCK Market.
Trade What you see not what you Think

VTL buy Charts for Educational purposes only.
Please follow strict stop loss and risk reward if you follow the level.
Thanks,

Vardhman Textiles: On the Verge of a Major Breakout! Vardhman Textiles: On the Verge of a Major Breakout!
Current Market Price: ₹554
Stop Loss: ₹420
Targets: ₹902 | ₹942
Key Highlights:
3-Year Rounding Bottom Formation: Vardhman Textiles is nearing a significant breakout level of ₹576, completing a large 3-year rounding bottom pattern.
Breakout Depth Target: Depth of the rounding bottom is ₹332. Adding this to the breakout point (₹576) gives a target of ₹902.
Fibonacci Extension Target: Aligns at ₹942, strengthening the potential for extended upside.
Key Levels: Sustained movement above ₹576 will confirm the breakout and signal a major upward move.
Strategy:
Preemptive Entry: Start building positions gradually to capture early gains.
Wait for Confirmation: Larger positions should be added after a decisive breakout above ₹576.
Risk Management: Maintain a strict stop loss at ₹420 to protect against downside risk.
📈 Outlook: Vardhman Textiles is showing robust potential for a breakout, with long-term chart patterns and Fibonacci levels aligning to support the bullish view. If confirmed, this move could result in a substantial rally toward ₹900+ levels.
📉 Disclaimer: As a non-SEBI registered analyst, I recommend conducting thorough research or seeking advice from financial professionals before making investment decisions.
#VardhmanTextiles #TechnicalAnalysis #BreakoutTrade #RoundingBottom #StockMarket #InvestmentOpportunities #TradingIdeas

VTL S/R Support and Resistance Levels:
Support Levels: These are price points (green line/shade) where a downward trend may be halted due to a concentration of buying interest. Imagine them as a safety net where buyers step in, preventing further decline.
Resistance Levels: Conversely, resistance levels (red line/shade) are where upward trends might stall due to increased selling interest. They act like a ceiling where sellers come in to push prices down.
Breakouts:
Bullish Breakout: When the price moves above resistance, it often indicates strong buying interest and the potential for a continued uptrend. Traders may view this as a signal to buy or hold.
Bearish Breakout: When the price falls below support, it can signal strong selling interest and the potential for a continued downtrend. Traders might see this as a cue to sell or avoid buying.
20 EMA (Exponential Moving Average):
Above 20 EMA: If the stock price is above the 20 EMA, it suggests a potential uptrend or bullish momentum.
Below 20 EMA: If the stock price is below the 20 EMA, it indicates a potential downtrend or bearish momentum.
Trendline: A trendline is a straight line drawn on a chart to represent the general direction of a data point set.
Uptrend Line: Drawn by connecting the lows in an upward trend. Indicates that the price is moving higher over time. Acts as a support level, where prices tend to bounce upward.
Downtrend Line: Drawn by connecting the highs in a downward trend. Indicates that the price is moving lower over time. It acts as a resistance level, where prices tend to drop.
RSI: RSI readings greater than the 70 level are overbought territory, and RSI readings lower than the 30 level are considered oversold territory.
Combining RSI with Support and Resistance:
Support Level: This is a price level where a stock tends to find buying interest, preventing it from falling further. If RSI is showing an oversold condition (below 30) and the price is near or at a strong support level, it could be a good buy signal.
Resistance Level: This is a price level where a stock tends to find selling interest, preventing it from rising further. If RSI is showing an overbought condition (above 70) and the price is near or at a strong resistance level, it could be a signal to sell or short the asset.
Disclaimer:
I am not a SEBI registered. The information provided here is for learning purposes only and should not be interpreted as financial advice. Consider the broader market context and consult with a qualified financial advisor before making investment decisions.


Upward Moving Channel Breakout - VTL📊 Script: VTL
📊 Sector: Textiles
📊 Industry: Textiles - Cotton/Blended
Key highlights: 💡⚡
📈 Script is giving Breakout of Upward Moving Channel on daily chart.
📈 Keep an eye on stock we may see some good rally.
📈 One can go for Swing Trade.
⏱️ C.M.P 📑💰- 535
🟢 Target 🎯🏆 - 572
⚠️ Stoploss ☠️🚫 - 520
⚠️ Important: Always maintain your Risk & Reward Ratio.
✅Like and follow to never miss a new idea!✅
Disclaimer: I am not SEBI Registered Advisor. My posts are purely for training and educational purposes.
Eat🍜 Sleep😴 TradingView📈 Repeat 🔁
Happy learning with trading. Cheers!🥂

VTL BO after a year long consolidation. wait for retest and do your own analysis before entering any trade. Boost the post if you like the post. Thank you

Focus on vardhman textile Ltd. Vardhman textile Ltd 2nd attempt to reach 550 Mark. Now VTL in a break out zone.

VTL: Breakout - retest - Continuation?The chart is self-explanatory as always :)
Want to request a specific analysis? Check our bio for details.
⚠️Disclaimer: We are not registered advisors. The views expressed here are merely personal opinions. Irrespective of the language used, Nothing mentioned here should be considered as advice or recommendation. Please consult with your financial advisors before making any investment decisions. Like everybody else, we too can be wrong at times ✌🏻

VTL SEEMS TO TRYING FOR BREAKOUT Entry @530 level sl day low target aim for 10% plus using 20% capital
Volume increasing
Trying for break out
Add more at 500 levels, using 40% capital
NOT A SEBI REGISTERED ANALYST VIEW / NO BUY OR SELL RECOMENDATIONS / MARKET INVESTMENT ARE SUBJECTED TO RISK. www.tradingview.com

Higher Highs Higher Lows - Short Sell - VTL📊 Script: VTL
📊 Sector: Textiles
📊 Industry: Textiles - Cotton/Blended
Key highlights: 💡⚡
📈 Script is forming Higher Highs Higher Lows patterns on daily chart.
📈 We may see stock price at 422 on downwards.
📈 One can go for Short Swing Trade.
⏱️ C.M.P 📑💰- 438
🟢 Target 🎯🏆 - 422
⚠️ Important: Always maintain your Risk & Reward Ratio.
✅Like and follow to never miss a new idea!✅
Disclaimer: I am not SEBI Registered Advisor. My posts are purely for training and educational purposes.
Eat🍜 Sleep😴 TradingView📈 Repeat 🔁
Happy learning with trading. Cheers!🥂

VTL- AnalysisFor 3-6 Months
Entry above 430
Conservative traders above 455
Stop loss Closing below - 370 or 365
Expected Targets -450 to 455 , 540 to 548 then 637 to 650
Please do your due diligence before trading or investment.
*Comment or message me if you wish to see my analysis for any stocks.
**Disclaimer -
I am not a SEBI registered analyst or advisor. I does not represent or endorse the accuracy or reliability of any information, conversation, or content. Stock trading is inherently risky and the users agree to assume complete and full responsibility for the outcomes of all trading decisions that they make, including but not limited to loss of capital. None of these communications should be construed as an offer to buy or sell securities, nor advice to do so. The users understands and acknowledges that there is a very high risk involved in trading securities. By using this information, the user agrees that use of this information is entirely at their own risk.
Thank you.


VTL Ascending TriangleAbove 380
Ascending Triangle will be break,
Target 430, 477
SL: 368
Risk is yours and Reward is too yours
Time Frame : 3 months

VTL(vardhman textiles)VTL is looking good for long run, it has ability to travel till 550 after the successfully crossing of 440. But as we are looking for short term there also good opportunity with small sl of 12 with the target of almost double.

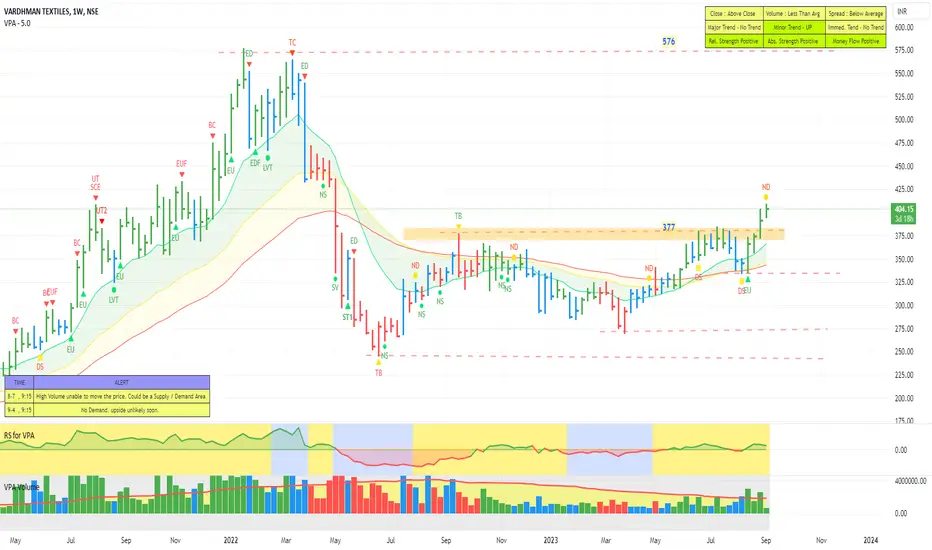
VTL: Positional BuyNSE:VTL Weekly chart showing positive formation exactly from weekly bottom averages. Also looks like rounding formation.

VTL - Ready to Move up The stock after a reversal is on recovery mode. Now making a Higher High and Higher Lows on Weekly and now on Daily as well. Relative Strength, Absolute Strength and Money flow all positive. The Stock looks strong to move up further and likely to test 576 levels.
VTL BREAKOUTBreakout in VTL with huge volume, if sustains 374 then 450-500 possible in short to medium term and stock pe is 18 , roe 11.33%, market cap 10000cr

Sellers is having Upper Hand !Hello @bhikhu65
As requested by you here what I see in this chart,
Strong Downtrend and it Downzone is may be deep
Up move is only expected 380 on Weekly Closing basis (as Rejection zone is 350-380)
Below Support Zone is near 245 and Price is testing this level is only once,
so my my expectation is Consolidation in the Below Zone and below that Downtrend will Continue as it is going on now.
will try to review this script after some time,
Thank you for your time, Love And Support.
All the best.
Gratify if you appreciate the practice then you can like it, share it and
If you want me to investigate any chart for you then would cherish doing that for you.
Thank you for your time and support.
Stay safe.

POSITIONAL EQUITY TRADE FOR REWARD : RISK 5:1
Price has changed the Trend upwards and has a buying confirmation, hence expecting an Impulsive Move Upward till the Opposite Quarterly Supply.
ENJOY THE RIDE !!!

VTL - KEEP IN WATCHLIST 📊 Script: VTL (VARDHMAN TEXTILES LIMITED)
📊 Nifty50 Stock: NO
📊 Sectoral Index: NIFTY 500
📊 Sector: Textiles
📊 Industry: Textiles & Apparels
Key highlights: 💡⚡
⚠️ Keep an eye on VARDHMAN TEXTILES .
⚠️ It is near at its resistance zone .
⚠️ Formation of Cup and handle pattern but 230 is resistance zone.
BUY ONLY ABOVE - 330
⚠️ If its give breakout then one can go for swing trade.
⚠️ Important: Always maintain your Risk & Reward Ratio.
✅Like and follow to never miss a new idea!✅
Disclaimer: I am not SEBI Registered Advisor. My posts are purely for training and educational purposes.
Happy learning with trading. Cheers!🥂
