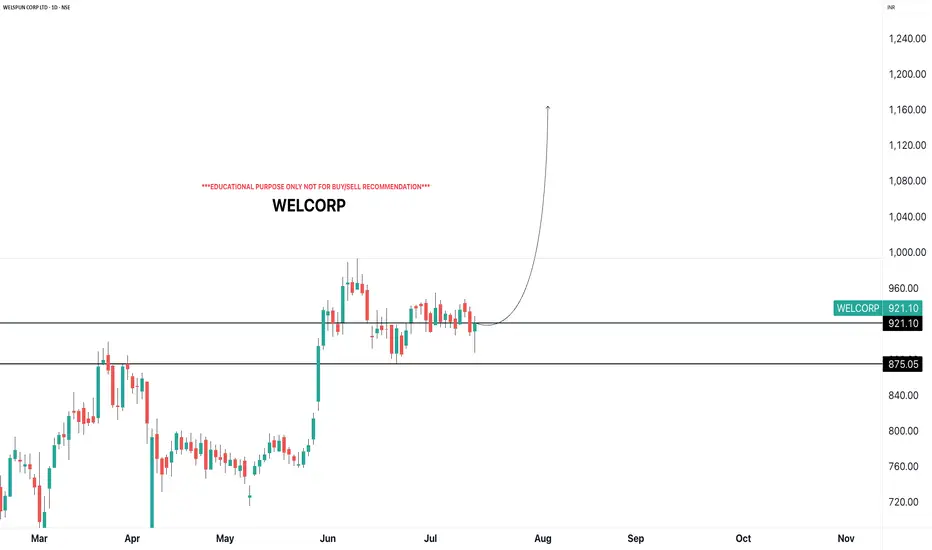
WELCORPi Observed these Levels based on Price Action and Demand & Supply which is my own Concept "PENDAM CONCEPTS"... Please don't take any trades based on this chart/post... Because this chart is for educational purpose only not for Buy or Sell Recommendation... Thank Q
WELCORP trade ideas
WELCORP - A case study in smart money accumulationHypothesis:
Historically, metal stocks have shown strong rallies following interest rate cuts. This is based on the premise that lower rates stimulate economic activity, driving demand for industrial metals and commodities. With the potential for a rate-cut cycle on the horizon, this creates an actionable setup for accumulation before a broader uptrend unfolds.
Strategy: “Accumulate the Red”
We propose an accumulation strategy tailored for this macro setup:
Accumulate 5–10% of your intended position on every red daily candle where the stock declines by more than 1%.
This allows for scaling into weakness, which historically has provided the best reward-to-risk entry points in these cyclical turnarounds.
Why This Works
Macro Tailwinds: Once interest rates peak, the cost of capital drops, benefiting infrastructure and industrial sectors.
Sentiment Mismatch: Market tends to remain overly bearish during the initial leg of a pivot, creating undervaluation.
Risk Management: Accumulating on red candles avoids chasing momentum and distributes entry risk.

Welspun seemed to have recently broke outWelspun seemed to have recently broke out of a strong resistance area.
🔎 Important Note: During market crash or prolonged corrections, strong stocks tend to correct later and with a smaller percentage decline.
⚠️ This is NOT a buy recommendation. Please consult your financial adviser before making any investment decisions.

SHORT-TERM INVESTMENT STOCK | BUY WELSPUN CORPWelspun corp looks a good buy above 802 for the target of 855 until 785 is intact on the downside.
To motivate us, Please like the idea If you agree with the analysis.
Happy Trading!
InvestPro India

Darvas Box Strategy - Break out Stock - Swing TradeDisclaimer: I am Not SEBI Registered adviser, please take advise from your financial adviser before investing in any stocks. Idea here shared is for education purpose only.
Stock has given break out. Buy above high. Keep this stock in watch list.
Buy above the High and do not forget to keep stop loss, best suitable for swing trading.
Target and Stop loss Shown on Chart. Risk to Reward Ratio/ Target Ratio 1:2
Stop loss can be Trail when it make new box / Swing.
Be Discipline, because discipline is the key to Success in Stock Market.
Trade what you See Not what you Think.

Welspun Corp Eyes ₹950! TP1 Hit, More Gains Ahead!Welspun Corp (WELCORP), on the 1-hour timeframe, has achieved TP1 and is showing a strong bullish trend, indicating potential movement toward TP2, TP3, and TP4. The Risological Swing Trading Indicator clearly identifies the trade setup with defined levels for an emotion-free strategy.
Welspun Corp Key Levels:
TP1: 764.60 ✅
TP2: 835.35 (Pending)
TP3: 906.10 (Pending)
TP4: 949.85 (Pending)
Welspun Corp Technical Analysis:
The entry point was at 720.90, and the trade setup was confirmed as the price crossed above the Risological Trend Line, signifying a bullish continuation.
A safe stop-loss was placed at 685.55, ensuring effective risk management.
The current consolidation near TP1 suggests a likely breakout to higher levels, with TP2 and TP3 being immediate targets.
As momentum builds, traders should watch for signs of trend continuation or reversals near TP levels for maximizing gains.

Darvas Box Strategy - Break out Stock - Swing TradeDisclaimer: I am Not SEBI Registered adviser, please take advise from your financial adviser before investing in any stocks. Idea here shared is for education purpose only.
Stock has given break out. Buy above high. Keep this stock in watch list.
Buy above the High and do not forget to keep stop loss, best suitable for swing trading.
Target and Stop loss Shown on Chart. Risk to Reward Ratio/ Target Ratio 1:2
Stop loss can be Trail when it make new box / Swing.
Be Discipline, because discipline is the key to Success in Stock Market.
Trade what you See Not what you Think.

Welspun corp Welspun corp
MTF Analysis
Welspun Corp Yearly Demand Breakout (in Process) 570
Welspun Corp 6 Month Demand BUFL (in Process) 631
Welspun Corp Qtrly Demand BUFL (in Process) 631
Welspun Corp Monthly Demand 554
Welspun Corp Weekly bufl 620
Welspun Corp Weekly DMIP 584
Welspun Corp Weekly DMIP 687
ENTRY 687
SL 651
RISK 36
Target 813
REWARD POINT 126
Last High 750
RR 3.50
RR 18%

WELCORP - Welspun Corp Ltd - Uptrend - Long Term1. Consolidation
2. 50% retracement
3. Support taken at support level
4. Double Bottom at support level
5. Break-out and close previous All time high
6. ADX - shows strength of the trend

WELSPUN CORP LTD S/RSupport and Resistance Levels:
Support Levels: These are price points (green line/share) where a downward trend may be halted due to a concentration of buying interest. Imagine them as a safety net where buyers step in, preventing further decline.
Resistance Levels: Conversely, resistance levels (red line/shade) are where upward trends might stall due to increased selling interest. They act like a ceiling where sellers come in to push prices down.
Breakouts:
Bullish Breakout: When the price moves above resistance, it often indicates strong buying interest and the potential for a continued uptrend. Traders may view this as a signal to buy or hold.
Bearish Breakout: When the price falls below support, it can signal strong selling interest and the potential for a continued downtrend. Traders might see this as a cue to sell or avoid buying.
20 EMA (Exponential Moving Average):
Above 20 EMA: If the stock price is above the 20 EMA, it suggests a potential uptrend or bullish momentum.
Below 20 EMA: If the stock price is below the 20 EMA, it indicates a potential downtrend or bearish momentum.
Trendline: A trendline is a straight line drawn on a chart to represent the general direction of a data point set.
Uptrend Line: Drawn by connecting the lows in an upward trend. Indicates that the price is moving higher over time. Acts as a support level, where prices tend to bounce upward.
Downtrend Line: Drawn by connecting the highs in a downward trend. Indicates that the price is moving lower over time. It acts as a resistance level, where prices tend to drop.
Disclaimer:
I am not a SEBI registered. The information provided here is for learning purposes only and should not be interpreted as financial advice. Consider the broader market context and consult with a qualified financial advisor before making investment decisions.

Darvas Box Breakout Disclaimer: I am Not SEBI Register adviser, please take advise from your financial adviser before investing in any stocks.
Keep on the watch list as WELCORP has given break out buy above the High and do not forget to keep stop loss best suitable for swing trading.

Consolidation Breakout - WELCORP📊 Script: WELCORP
📊 Sector: Steel
📊 Industry: Steel - Large
Key highlights: 💡⚡
📈 Script is giving consolidation breakout on daily chart.
📈 One can go for Swing Trade.
⏱️ C.M.P 📑💰- 696
🟢 Target 🎯🏆 - 756
⚠️ Stoploss ☠️🚫 - 663
⚠️ Important: Always maintain your Risk & Reward Ratio.
✅Like and follow to never miss a new idea!✅
Disclaimer: I am not SEBI Registered Advisor. My posts are purely for training and educational purposes.
Eat🍜 Sleep😴 TradingView📈 Repeat 🔁
Happy learning with trading. Cheers!🥂

Welspun Corp above 664 - Flag and Pole Breakout ProbabilityWelspun Corp looks good above 664 with a flag and pole pattern...
Disclaimer:
This analysis is for informational purposes only and does not constitute investment advice. Trading involves significant risk and may result in the loss of capital. Always conduct your own research or consult a financial advisor before making investment decisions. I am not responsible for any actions taken based on this analysis.

Welspun corp ltd Intraday level for 26th July #WELCORPWelspun corp ltd Intraday level for 26th July #WELCORP
Buying may witness above 646
Support area 635-640. Below ignoring buying momentum for intraday
Selling may witness below 629
Resistance area 635-640. Above ignoring selling momentum for intraday
Charts for Educational purposes only.
Please follow strict stop loss and risk reward if you follow the level.
Thanks,
V Trade Point

Welspun corp ltd Intraday level for 25th July #WELCORP Welspun corp ltd Intraday level for 25th July #WELCORP
Buying may witness above 672
Support area 665. Below ignoring buying momentum for intraday
Charts for Educational purposes only.
Please follow strict stop loss and risk reward if you follow the level.
Thanks,
V Trade Point

Welspun Corp Ltd Intraday level for 12th July #WELCORP Welspun Corp Ltd Intraday level for 12th July #WELCORP
Buying opportunity above 671
Support area 665. Below ignoring buying opportunity
Charts for Educational purposes only.
Please follow strict stop loss and risk reward if you follow the level.
Thanks,
V Trade Point

breakout happened with very good volume breakout happened with vey grate volume, wait for retest, risky investors can also take chance at this level...

WELCORP (DAILY)Welspun Corp (Daily Chart)
CMP - 629
3 monghs range breakout and close
Rounding bottom
Volume increased
Can see good move upside if breakout sustains

welcorp monthly chart
Welcorp Stock Breaks 2007 High: Navigating the Opportunity
Welcorp's stock recently surpassed its 2007 high, creating a buzz among investors and traders. This achievement suggests that the stock is entering a potentially sustained uptrend. With the potential for gains estimated at 80% and a risk of around 24%, it's crucial to have a comprehensive trading plan to capitalize on this opportunity while managing potential risks.
Trading Plan
Welcorp's breakout indicates a positive market sentiment, offering an 80% potential upside. However, trading always involves risks, and in this case, the risk is approximately 24%. To make the most of this opportunity, you can employ technical analysis tools to guide your decisions.
Risk Management
An effective way to mitigate risk is by using a stop-loss order. Given the volatile nature of the stock market, setting a stop-loss at a level that aligns with your risk tolerance can help limit potential losses. To enhance this approach, consider the following strategies:
Trailing Stop-Loss with Supertrend: The Supertrend indicator can be used to set a trailing stop-loss. This method allows you to lock in gains while providing flexibility to ride the trend as long as it lasts. As the stock price rises, the Supertrend will adjust, enabling you to capture more profits while reducing the risk of sudden reversals.
Monitoring the RSI Trendline: The Relative Strength Index (RSI) is a helpful tool for gauging market momentum. If the RSI trendline breaks, it might indicate a shift in sentiment, prompting a potential exit or reevaluation of your position. Keeping an eye on the RSI trendline even after hitting your target can help you stay in tune with the broader market trend.
Beyond the Target
Even after your target is achieved, it’s wise to continue monitoring the stock's performance using both the Supertrend and the RSI trendline. This approach helps you decide whether to maintain your position or exit. If the Supertrend starts to turn or the RSI trendline breaks, it could be a sign that the trend is weakening, suggesting that it might be time to take profits or cut losses.
Conclusion
Welcorp's breakthrough above its 2007 high is a notable event, offering significant upside potential. However, trading success relies on careful risk management and constant monitoring of market indicators. By using a combination of trailing stop-loss with Supertrend and closely watching the RSI trendline, you can effectively manage your risk and adapt to changing market conditions. Stay alert, and let’s see how this trend unfolds, with an eye toward capturing gains and minimizing risks.

welspun
** Co receives letter of award worth 6.11 bln rupees ($73.4 mln) for the supply of LSAW pipes, along with coating and bends, in the Latin American region
** The execution of this contract shall be done in FY25 - Welspun


