Review and plan for 21st May 2025 Nifty future and banknifty future analysis and intraday plan.
Quarterly results.
This video is for information/education purpose only. you are 100% responsible for any actions you take by reading/viewing this post.
please consult your financial advisor before taking any action.
----Vinaykumar hiremath, CMT
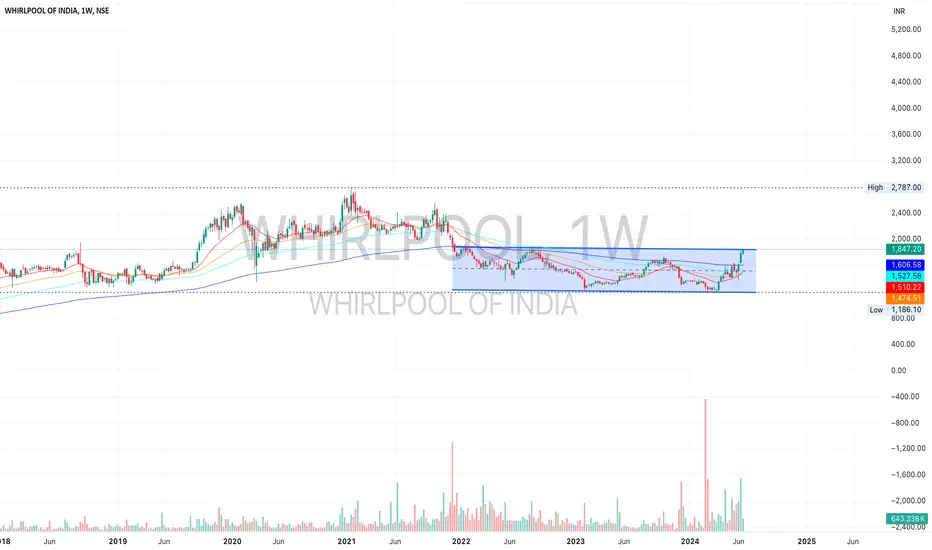
WHIRLPOOL trade ideas

Ride for break all Resisstance...NSE:WHIRLPOOL trade at 2180 level.
Support is at 2000
Resistance is at 2250
You can watch it for 2470, 2770, 3070

WHIRLPOOL OF INDIA LTD S/RSupport and Resistance Levels:
Support Levels: These are price points (green line/shade) where a downward trend may be halted due to a concentration of buying interest. Imagine them as a safety net where buyers step in, preventing further decline.
Resistance Levels: Conversely, resistance levels (red line/shade) are where upward trends might stall due to increased selling interest. They act like a ceiling where sellers come in to push prices down.
Breakouts:
Bullish Breakout: When the price moves above resistance, it often indicates strong buying interest and the potential for a continued uptrend. Traders may view this as a signal to buy or hold.
Bearish Breakout: When the price falls below support, it can signal strong selling interest and the potential for a continued downtrend. Traders might see this as a cue to sell or avoid buying.
20 EMA (Exponential Moving Average):
Above 20 EMA(50 EMA): If the stock price is above the 20 EMA, it suggests a potential uptrend or bullish momentum.
Below 20 EMA: If the stock price is below the 20 EMA, it indicates a potential downtrend or bearish momentum.
Trendline: A trendline is a straight line drawn on a chart to represent the general direction of a data point set.
Uptrend Line: Drawn by connecting the lows in an upward trend. Indicates that the price is moving higher over time. Acts as a support level, where prices tend to bounce upward.
Downtrend Line: Drawn by connecting the highs in a downward trend. Indicates that the price is moving lower over time. It acts as a resistance level, where prices tend to drop.
RSI: RSI readings greater than the 70 level are overbought territory, and RSI readings lower than the 30 level are considered oversold territory.
Combining RSI with Support and Resistance:
Support Level: This is a price level where a stock tends to find buying interest, preventing it from falling further. If RSI is showing an oversold condition (below 30) and the price is near or at a strong support level, it could be a good buy signal.
Resistance Level: This is a price level where a stock tends to find selling interest, preventing it from rising further. If RSI is showing an overbought condition (above 70) and the price is near or at a strong resistance level, it could be a signal to sell or short the asset.
Disclaimer:
I am not a SEBI registered. The information provided here is for learning purposes only and should not be interpreted as financial advice. Consider the broader market context and consult with a qualified financial advisor before making investment decisions.

cool cool whirlpool
### 1. **9-Month Consolidation (📦 Box Pattern)**
**Pattern**: **Rectangle/Box Consolidation**
**Details**: The price has been **moving sideways** within a range of about **₹300 points** for the last 9 months, creating a consolidation zone. This period of consolidation indicates **indecision** in the market, where neither bulls nor bears have taken full control.
- **Implications**:
If the price **breaks above the consolidation zone**, it could signal a **bullish breakout** and may lead to further price increases.
A **breakdown** below this zone would signal a potential bearish move.
### 2. **Volume Spike (🔺)**
**Pattern**: **Volume Spike with Price Breakout Attempt**
**Details**: Toward the right side of the chart, there is a visible **increase in trading volume** during the consolidation, which usually signals an **impending breakout**.
- **Implications**:
**Rising volume** is typically a precursor to a strong price move. If the breakout from the consolidation happens with sustained volume, it will confirm the validity** of the breakout.
### 3. **Descending Trendline Break (📉)**
**Pattern**: **Trendline Breakout**
**Details**: The stock had been in a **downtrend** for a prolonged period from **2021** until early **2023**, as indicated by the purple **descending trendline**. However, this trendline was broken in early 2023, signaling a potential end to the downtrend.
- **Implications**:
A **trendline break** suggests a potential **shift in sentiment** from bearish to bullish. The fact that the price has stabilized and entered a consolidation phase after the break hints that the stock might be building a base for future upward movement.
### 4. **Gap Down Recovery (⬇️⬆️)**
**Pattern**: **Gap Fill**
**Details**: In **Dec 2021**, there was a **gap down**, which is a significant drop in price. However, by Jan 2024**, this gap was **filled** with a strong **gap-up move**, indicating that the price returned to its previous levels.
- **Implications**:
**Gap fills** are often seen as signs of market strength, and in this case, it signals that the stock has recovered from prior selling pressure and may be positioned for further gains.
### 5. **Resistance Levels (🔴 Horizontal Lines)**
**Pattern**: **Horizontal Resistance**
**Details**: The price is nearing two major **resistance levels**:
**First Resistance at ₹2,534.70**
**Second Resistance at ₹2,754.50**
- **Implications**:
If the price moves toward and tests these resistance levels, a **break above these points** would be a very **bullish signal**. However, if the stock struggles to break these levels, it could face **rejection** and move back toward support.
### Summary:
The stock of Whirlpool of India Ltd. has been **consolidating** for a significant period, indicating the market is indecisive and waiting for a catalyst.
The **breakout from the trendline** and **volume spike** are signs of potential strength.
A **breakout above the consolidation** zone could lead to a move towards testing **higher resistance levels** (₹2,534 and ₹2,754).
Keep an eye on **volume** to confirm any breakout, and be cautious around the major resistance levels, as a rejection could trigger a **pullback**.
This suggests that the stock is at a **crucial point** where either a breakout or breakdown could occur, and the next move will largely depend on market forces around these critical price levels.

Key Support / Resistance Breakout - Swing TradeDisclaimer: I am not a Sebi registered adviser.
This Idea is publish purely for educational purpose only before investing in any stocks please take advise from your financial adviser.
Key Support & Resistance Breakout. Stock has give Breakout of Resistance level. Keep in watch list. Buy above the high. Suitable for Swing Trade. Stop loss & Target Shown on Chart.
Be Discipline because discipline is the Key to Success in the STOCK Market.
Trade What you see not what you Think.

WHIRLPOOL Swing Long SetupEnter only when 15minute candle closes above the Entry Zone Price - 2084.60
Target with Risk to reward 1:2 is 2293
Stoploss only when 1 day candle closes below the price - 1980.20
Note: This is not any financial advice, this is for education purpose only.


2657 TARGET VERY SOON GOOD BULLISH SIGNAL
IT WILL COME AT 1860 LEVEL FOR RETEST
THEN IT WILL GO FOR 2700
YOU SHOLD KEEP EYES ON THIS STOCK....IT CAN MAKE HIGH 2800 SO THIS IS ONLY RETEST
A price pattern is a recognizable configuration of price movement identified using a series of trendlines and/or curves. When a price pattern signals a change in trend direction, it is known as a reversal pattern; a continuation pattern occurs when the trend continues in its existing direction following a brief pause.

go long - swing pick- this stock shows signficant delivery percentage value
- possible chances for accumulation
- may perform good in upcoming days
- this stock is picked after market close based on delivery qty data.
- follow this stock for next 5 days , if entry not triggered with in 5 days , ignore pick
- line marked in chart is the day it showed huge delivery percentage.i consider it as signal candle.i marked its high and low
entry
- go long with 1:1.5 RR
- take entry if 15min close crosses the line , ignore entry if it made gap ups
- i prefer entry with in 5 days , if not triggered ignore this pick
sl
- candle close below signal candle's low
target
- keep 1.5 times of sl.

Whirlpool for LongWhirlpool is looking good for long term, entry at current level looks good for a period of 1 - 2 Year.
With the market cap of Rs 23,388 cr, it is the biggest company in the sector and constitutes 37.10% of the entire sector
Note: Please consult your financial advisor before making any investments. This idea is only for educational purpose.
Stock of the Week: Whirlpool of India with Consistent Dividends
Fundamental Analysis:
NSE:WHIRLPOOL Whirlpool of India has shown consistent financial strength, making it a top pick for this week. The company has maintained higher dividends for the past seven years, highlighting its commitment to returning value to shareholders. As a prominent player in the household consumables sector, Whirlpool benefits from strong market positioning. Additionally, its liquid assets exceed any obligations, ensuring financial stability and flexibility.
Technical Analysis:
From a technical perspective, NSE:WHIRLPOOL Whirlpool of India is exhibiting a bullish double bottom pattern, which is a strong indicator of potential upward movement. The stock is currently in a buying zone, following a significant two-year breakout on the back of NSE:HINDUNILVR HUL news. This breakout is supported by higher relative strength compared to the broader market and a good volume range, indicating robust investor interest.
Trade Setup :
• Entry: Buy in the buying zone indicated in the chart
• Stop Loss: 1630.15
• Potential Upside: 2553 (35-40%)


Whirlpool on the verge of Weekly BreakoutWhirlpool on the verge of Weekly Breakout. It is consolidation with limited downside price action now.


Whirlpool LongMarket Cap: ₹ 21,601 Cr.
Whirlpool of India Ltd is one of the leading manufacturers and marketers of major home appliances in the country.

Whirlpool of India Ltd (WHIRLPOOL) AnalysisThe chart provided is of Whirlpool of India Ltd (WHIRLPOOL) listed on the National Stock Exchange (NSE) of India, on a weekly timeframe. Here’s a detailed analysis and summary:
1. Trend Analysis:
- The stock had a strong uptrend from early 2020 to early 2021.
- Since mid-2021, the stock has been in a downtrend, forming lower highs and lower lows.
- Recently, the stock has shown signs of a potential trend reversal with a breakout above the downtrend line.
2. Support and Resistance Levels:
- Support:
- Major horizontal support around 1269.45.
- Resistance/Targets:
- Target 1: 1738.45
- Target 2: 1888.40
- Target 3: 2246.90
- Target 4: 2435.95
- Ultimate resistance: 2683.65
3. Breakout:
- The stock has recently broken out above the descending trendline, indicating potential bullish momentum.
- This breakout is significant as it suggests a reversal from the prolonged downtrend.
4. Chart Patterns:
- A descending triangle pattern was in place from mid-2021 to 2023.
- The breakout above the descending trendline signals a potential end to this pattern and a shift towards a bullish trend.
5. Current Price Action:
- The current price is 1620.90, indicating a strong bullish move recently.
- The stock is approaching the first target at 1738.45.
6. Moving Averages and Indicators:
- The chart does not explicitly show moving averages or other indicators, but the breakout and resistance levels provide key insights.
Summary:
The chart of Whirlpool of India Ltd (WHIRLPOOL) indicates a recent breakout above a descending trendline, suggesting a potential reversal from its long-term downtrend. The stock has shown strong bullish momentum, with the current price at 1620.90. Key resistance levels to watch are 1738.45, 1888.40, 2246.90, and 2435.95, with ultimate resistance at 2683.65. The major support level is at 1269.45. The breakout is a positive signal, indicating the potential for further upside if the stock can sustain above the breakout level and move towards its targets.

WHIRLPOOL 1:18+ RR trade set up1. Trend: downtrend to sideways
2. Probable support area for reversal
3. Early entry will give highest reward with least risk
4. Can keep booking partials on the way to reduce risk if downtrend continues after a pull back

WHIRLPOOL LONGHello! Traders, In this Chart Whirlpool is accumulating for the Long positional trade. It may be a good entry after MACD line Crossing the signal line.
Like and Comment Below
Follow me for more updates.
This is not a trade advice DYOR before any trades.

WHIRLPOOLWHIRLPOOL Chart Analysis 02/04/2024.........
Long
Sl : 1180
Target : 1390 / 1520 / 1725 / 1900
Enjoy !

WHIRLPOOL Buy SetupSuper valid-looking! Leave a comment if you like my entry setup. This share is for educational learning purposes only, and I am not responsible for your profit or loss. Note: For more details, check the chart."

WHIRLPOOL: SUPPORT LEVELSNSE:WHIRLPOOL is currently trading at its 2018 low levels, indicating a significant downtrend in the stock's price over the past few years. However, the recent formation of a hammer candlestick pattern suggests a potential reversal in the downward trend. Yesterday's hammer candlestick, followed by today's confirmation, indicates that buyers have stepped in to support the stock at these levels, potentially signaling a shift in sentiment.
The hammer candlestick pattern is characterized by a small body with a long lower wick, indicating that despite a period of selling pressure, buyers were able to push the price back up, typically closing near or above the open. This pattern is considered bullish when it appears after a downtrend, as it suggests that sellers may have exhausted their momentum and that buyers are starting to gain control.

Short - WhirlpoolThe Market is heavy sell side but it will take a breath and follow the fall
As per price action formation has been made in 1 week TF.
Its a very big move.
Always check the sentiments of the market as per technical analysis, if the pattern get its respect.
Best of luck to all traders.
You are responsible for your Profits and loss, Shared for Educational purpose

Stocks Trading at 50% DiscountWhirlpool India is trading at around 50% down from its all time high, and the level which is trading at is bounce back zone, every time it came to that support it has always bounced, good opportunity to grab this stock at ideal price level.
this stock pays dividend and its debt level is negligible.
