wiprostock on no trading zone.
it may go more down from here, please wait and watch.
already on support, wait for break down.
WIPRO trade ideas

wiproits my analysis of wipro chart on crossing the those levels we can go for buying or selling. correct me if wrong

wipro making bilateral pattern according to my analysis wipro can go up or down because on chart it making a bilateral pattern which is ascending triangle pattern, on monday we can expect a up or downside moment from Wipro

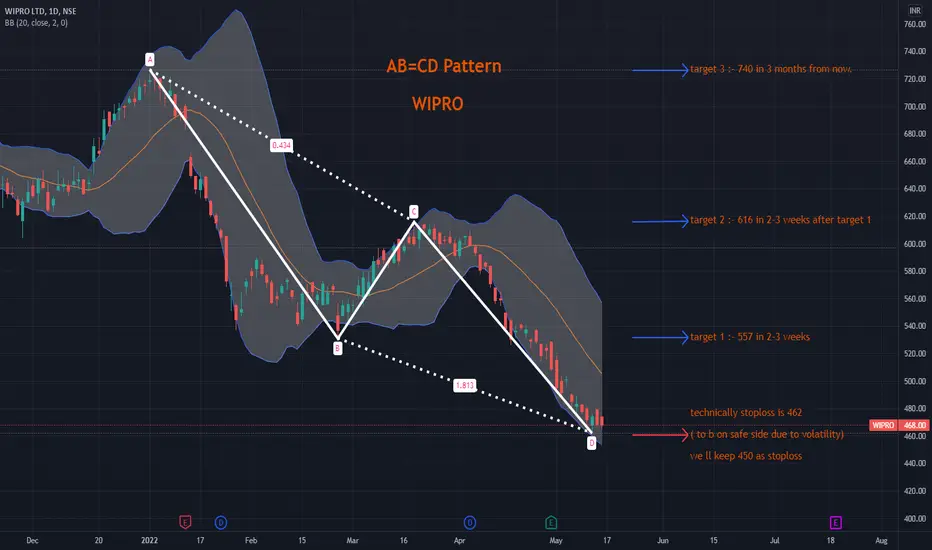
WiproWipro made an AB=CD pattern (if it dont extend losses from here & reverses) on daily charts, if overall market & IT index made bottom here reverses,
Then, could be bought with mentioned stoploss & targets.
Risk to reward ratio is well in favour of bulls.
$WIT with a Bearish outlook following its earnings #Stocks The PEAD projected a Bearish outlook for $WIT after a Negative Under reaction following its earnings release placing the stock in drift D with an expected accuracy of 62.5%.

WIPRO may bounce back in range @397-415Based on Fibonacci Retracement Analysis (plus Resistance @397), Wipro is likely to Bounce back within the range of Rs 397 - 415. Keep the Stop Loss at Rs 380. Set Target Rs 600. Risk(35):Reward(185) R:R ==> 1:5.28

Wipro (weekly)Wipro into weekly demand zone (490-440).
This price sensitive zone can produce good bounce atlist till 580-630.🤞

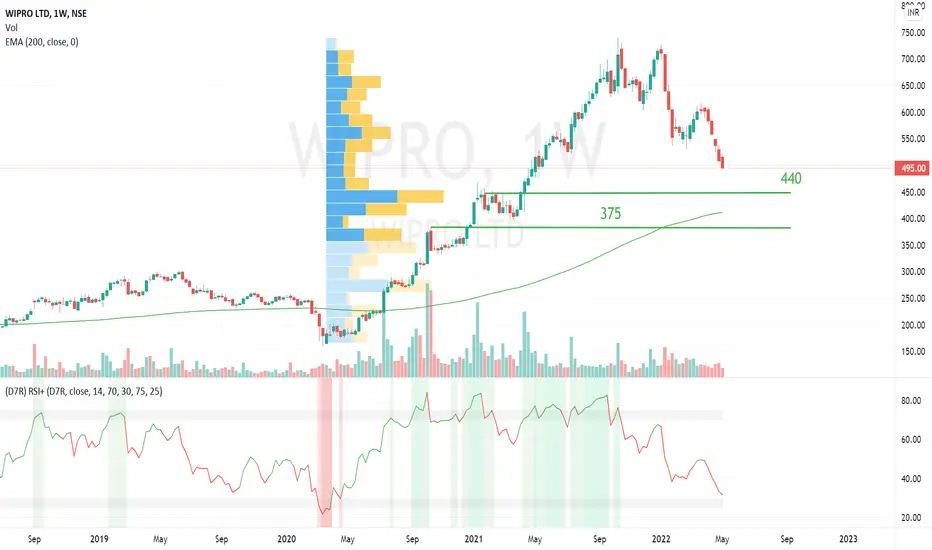
WIPROWIPRO - Analysis
Buying to be initiated from 440 & 375 levels.
Stock expected to correct up to those levels.
No shorts RECO!!
One Swing trading Equity Option -WIPRO WIPRO Sell below 579
SL 616 on weekly closing basis
Target:- 554, 527, 450
So, we have to initiate a bull put spread -
April Expiry
580 Put buy along with 550 Put sell
If 550 is not achieved in the April expiry then one can again take this trade for next month's expiry provided the trade should be in profit.
(For example:-u can initiate 560 Put buy along with 530 put sell if Wipro would trade at 560.
u can initiate 540 Put buy along with 510 put sell if Wipro would trade at 540.)
Disclaimer: -Views are for ‘’EDUCATIONAL PURPOSE ONLY’’
Trade at your own risk.

WIPRO trading at 300Rs premium from its Covid PriceWipro after this fall and at 500 this is trading with the premium of 300 Rs from its last covid price.
this is reasonable for the IT stock as well as after meeting at the adjustment of Inflation.
In my view this is trading in reasonable price for the longterm accumulation.


Wipro shortWipro on a Weekly TF looks weak among other stocks, it has already achieved double top target and has broken all the previous supports....looking at the chart pattern and keeping Elliott wave perspective, we can look forward for a target of 410-420 in the coming month.

Wipro ShortWipro on a Weekly TF looks weak among other stocks, it has already achieved double top target and has broken all the previous supports....looking at the chart pattern and keeping Elliott wave perspective, we can look forward for a target of 410-420 in the coming month.

Wipro ShortWipro on a Weekly TF looks weak among other stocks, it has already achieved double top target and has broken all the previous supports....looking at the chart pattern and keeping Elliott wave perspective, we can look forward for a target of 410-420 in the coming month.

Wipro at critical level - 30/4/22It should start up journey from tomorrow itself and if it breaks 500 levels then next it might see 490,450,400 levels as per my analysis. Rest Allah knows best


Double Top Formed Accumulate this power-packed industry leader
Expected to provide a above average quarterly earnings

Wipro LimitedWipro Limited is an Indian multinational corporation that provides information technology, consulting and business process services. Thierry Delaporte has served as CEO and managing director of Wipro since July 2020. It is headquartered in Bangalore, Karnataka, India. Wikipedia
Stock price: WIPRO (NSE) ₹537.70 +7.25 (+1.37%)

Wipro Ltd Pull backWipro Can pull back now
after triangle Retest
Now Can Go upside For 1st target 543.0
and 2nd target 545
and 3rd target 547
and Stop Loss 536.60

WIPRO Analysis it can be a good swing or opportunity to buy this stock at lower price and sell at higher price.
Wipro is currently at its support level with bullish Rsi divergence so you all have to just wait for the green candle to close above support level.
ONLY BUY WHEN IT MAKE GREEN CANDLE


NSEWipro is floating in the channel since more than two days, it's good to Buy Wipro @ 593 , cell at 612,. Stop loss 585.

WiproBuy if breakout of resistance 614 took place
Or else
Buy if again available at 590 as it is best support level
Ask your financer before buying.....
