WIPRO trade ideas

Target 770 Wipro is retesting the support zone for quite a long time. CMP is 658, Buying will be feasible above 662. Wait for a confirmation candle i,e if tomorrow ends up in green take entry by day after tomorrow. Target is 770 by the end of the year 2021.


for long swing traders its your timefor long swing traders its your time to make profit, NOTE : For Swing trading who can hold

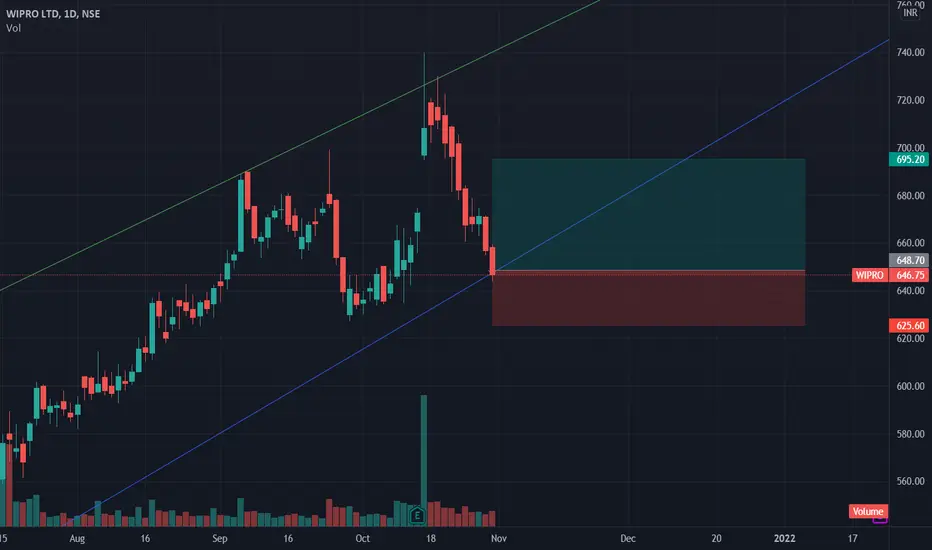
Wipro ReversalThe stock has reached lower trendline and may undergo a reversal rally. Trade is supported by brokerage calls and Supports Nearby.
Risk Reward Ratio - 2:1
SL is placed below support zone & the lower trendline. The target is placed near swing high.
Buying opportunity for WiproWipro is currently in touching it's bottom Trend line so it can go again bullish...
Take your own risk this is not a buy or sell call

Wipro Taking Support on trendlineWipro might fly from here if market supports tomorrow. As it is taking support on trendline on 1hr time frame.

Swing Trade: WIPROGo long.
Quick returns possible.
And if possible, go for options of Nov expiry.
Good luck!!

WIPRO - BUYWipro - BUY
Looking strong on Charts
RSI - 56.94 which is good to enter @ CMP
1st Target - 679
2nd target 691
Happy Trading
Like & Follow :)

Short sellAccording to volume wipro will be retrace near to 715 and there we take sell entry at 715 and after we have two target i.e TP1. 690. TP2. 680
SO WAITING FOR ENTRY LEVEL AND ENJOY PROFIT

WIPRO Analysis Buy at supportWIPRO Analysis Buy at support Good Risk Reward
Buy 535
SL 528
TG 550/560


Upcoming Breakout in Wipro1. 5 Star Strategy :
- Monthly RSI > 70
- Weekly RSI > 70
- Daily RSI is bouncing back by taking support near 40 with good volume
2. Volume :
- The daily RSI chart is coming towards for 60 with good volume.
- This shows the market is expecting the Q2 result will be positive the stock.
3. Moving Average :
- The 5 days ema have crossed the 26 days ema and 13 days ema from below.
- This show there is a higher probability for a start of uptrend in Wipro.
- MACD is also about to cross the zero line to show green signal.
4. Earning Release :
- Today Wipro will release the Q2 result.
- The expectation is on growth in profitability of the company.


WIPRO DAILY CHART Taking support at 50 sma . rsi is giving bullish divergence . best buy in 635-638 zone , intraday tgt 648-650 . positional tgt 662-665

Wipro - SellWipro - Sell
Weak on Charts
We would be able to see 613 levels if the downtrend Continues
Target - 613


WiproWipro made Bullish H&S pattern.
Derivative Data suggests short covering in 670 ce.
Buy @ CMP with sloss of 665 & Tgt of 695

Wipro Below 653 Weak and can sell for a target of 648 and 640Wipro Below 653 Weak and can sell for a target of 648 and 640

Wipro Forming Falling Triangle 20 Sept 2021Wipro Forming Falling Triangle 20 Sept 2021. Lookout for Breakout

Price ActionTrend lines can be used to trade, if it closes beyond those trend lines trade can be taken respectively
