Xchanging Solutions - Breakout on the cardsAfter large cap IT stocks, time has come for small and Midcap it stocks..
Can go long with breakout candle low as SL (WCB)..
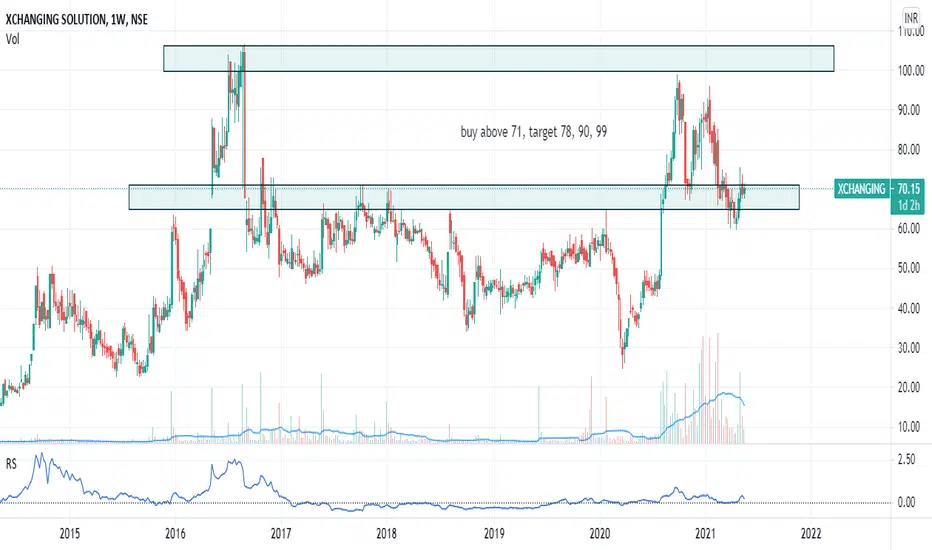
XCHANGING trade ideas

SWING IDEA - XCHANGINGNSE:XCHANGING has been rallying since the last few months. Currently it is at a S/R zone of 128. We have to wait a couple of weeks to see if this will turn out to be a Support Zone or a Resistance zone.
If it turns out to be a good Support Zone, we also have a MACD crossover incoming and once the crossover completes, it can rally up the stock at least till its Swing High Levels.
Another point to note is while the Lower Low Pattern on Price Action and Higher High Pattern started forming in the April of last year, this is only the next MACD crossover we are going to see after that.

Applying Fan's Principle on XCHANGING!Fan Pattern in NSE:XCHANGING !
3rd Fan Line Breakout in XCHANGING!
XCHANGING SOLUTION Analysis on a Monthly Time Frame!
Analysis:
Hello all, as you can see I have applied the Fan Principle on XCHANGING SOLUTION, It is a type of Multi time frame analysis, Where we can draw multiple trendlines from an All-Time High price point. As per the Fan's Principle, there is a trend reversal When the price breaks the 3rd Fan Line.
Disclaimer = Consider my analysis for Educational Purposes only.
Before entering into any trade -
1) Educate Yourself
2) Do your research and analysis
3) Define your Risk to Reward ratio
4) Don't trade with full capital

XCHANGING Solution - Buy on Breakout or Retest Support & HoldTechnical Analysis of Xchanging Solutions
Overview of the Stock - The chart presents a bullish outlook for Xchanging Solutions (XCHANGING) on the 1-hour timeframe. The analysis is primarily based on support and resistance levels, along with the 200 EMA (Exponential Moving Average) as a trend indicator.
Key Observations
Uptrend: - The overall trend appears to be bullish, indicated by the higher highs and higher lows formed by the price action.
Support Levels: - Several horizontal lines act as potential support levels. Notably, the 121.38 level seems to have provided strong support in the past, with the price bouncing off it multiple times.
Resistance Levels: - The chart displays resistance levels at 129.32, 135.70, and 142.00. Breaking through these levels could signal further upward momentum.
200 EMA: - The 200 EMA (currently at 129.34) is below the price, which is generally considered a bullish sign. However, it's essential to monitor its position relative to the price for potential trend changes.
Fibonacci Retracement: - The Fibonacci retracement levels are used to identify potential support and resistance areas. The 0.618 level (around 119.94) is a crucial support level to watch.
My Personal Opinion
Bullish Bias: Based on the current chart pattern, a bullish bias is suggested.
Potential Entry Points: Buying opportunities could arise when the price retests the support levels, especially the 121.38 level.
Stop-Loss: It's crucial to use stop-loss orders to manage risk. Placing a stop-loss below the nearest significant support level can help limit potential losses.
Target Levels: Potential profit targets can be set at the resistance levels of 129.32, 135.70, and 142.00 (Short Term)
Risk Management: Remember to implement proper risk management strategies, such as position sizing and diversification.
Disclaimer: This analysis is based solely on the provided chart and does not consider fundamental factors. It's essential to conduct thorough research before making any investment decisions as I am not SEBI registered person
Thanks for your support as always

XCHANGING BREAKOUTTrendline Breakout .
Cup & Handle pattern visible in Weekly Time Frame.
Massive Volumes.
Good for Short term and Long term .
Disclaimer : This is not a Buy or Sell recommendation. I am not SEBI Registered. Please consult your financial advisor before making any investments . This is for Educational purpose only.

Xchanging solutionsenter @100 and hold for massive upside once 125 is crossed..70-100 is accumulation zone. long term holding only.. short term players to avoid.

Xchanging Solutions might give 16% moveRationale for Trade
1. Bounce from 30 EMA on Weekly
2. Resistance Turned Support (W)
3. FIB 0.5 Level
4. Retracement done on Very Low Volumes
5. TTM Squeeze and Shakeout on Daily
6. Broken 23rd Oct Selloff High
7. Fresh IV on 30th Oct
8. Very Strong RS

XCHANGING offering great returnCNXIT just started to outperform. XCHANGING offers a good risk to reward. Nifty at ATH. INDIA VIX crashing. FII buying. Dividend notification

xchanging solution
recommendation of Interim dividend for the financial year 2023-24 of Rs. 15/-
per equity share of face value of Rs. 10/- each (150%), subject to declaration of
the same by the members at the ensuing 22nd Annual General Meeting (“AGM”)
of the Company. Dividend, if declared by the members, shall be credited /
dispatched within 30 days from the date of 22nd AGM.
The Record date to determine those members who will be eligible to receive the
payment of Interim dividend for the financial year 2023-24 (“Interim
Dividend”), subject to the approval of the members of the Company in the
upcoming 22nd AGM, will be Friday, July 28, 2023.

Xchanging Solutions-Nice breakoutXchanging Solutions-Nice breakout.
Capital to be deployed- 20k
Investing Price -105-107
Breakout Price -105
Stoploss-86
#xchangingsolutions #stockmarkets #StocksToBuy #StockToWatch #StocksInFocus #stockstowatch

Buy XCHANGINGXCHANGING SOLUTION
Buy Above 92
T1: 101
T2: 110
T3: 120
..Small Resistance at 97..
Keep SL of 79 on Daily Closing Basis.
Can explode anytime !!
..This is a reversal trade, above 92 trend will change..looks like accumulation on going for next rally..


XCHANGING SOLUTIONXCHANGING SOLUTION
Good uptrend
MACD - Strong
Above 50 Days Moving Average
1st Targets - 137
Support - 123 Levels
Happy Trading
Like & Follow :)

XCHANGING SOLUTIONS AS ON 06.08.2021A FLAG PATTERN is being formed !!
AND IF IT GIVES A BREAKOUT!!
Then can make a good call!!
and a new 52 WEEKS HIGH WILL BE FORMED!!
DO CHECK FOR RSI AND MACD ONCE on the day of breakout!!
STOP LOSS= 105/111
Can give a good call within 2-3 days!!
(THE ABOVE ANAYLSIS IS ONLY FOR STUDY PURPOSE do not take it as any buy or sell call)

XCHANGING - Multibagger alert!!The stock has come out of 5 years of consolidations, with tremendous volumes.
105 is the retest level.
keep 85 as SL.


ADITYA JAIN TODAY'S VIEW (FOR Educational Purpose)Buy Above: 68, Stoploss: 48
(Last Price 66.60): A wave 5 rally from 60.15 is expected to develop impulsively after corrective 3 wave decline of wave 4 low at 60.15, a wave 5 should advance beyond 98.90 with Projected Target – 112


monthly head & shoulder breakout above 100 nedded entry @ 50/55
target 100/200/300
sl below 42
portfolio allocation 1%
