ZEEL trade ideas
V Shape ReoveryZEEL had given the breakout of V on daily chart backed up with heavy volumes.
It is gng for Golden Crossover too..
My target is ard 200 in ard next 4-6 months

ZEEL Breakout Alert📈 ZEEL Breakout Alert
Price smashing through resistance at ₹145 with strong volume surge 🔥
✅ 12%+ up today
✅ Breakout after accumulation
✅ Projected RVol: 10.1x
🧠 Volume pattern + earnings improvement = Smart money action?
#ZEEL #Breakout #StockMarketIndia #TradingView #TechnicalAnalysis NSE:ZEEL

Review and plan for 18th June 2025 Nifty future and banknifty future analysis and intraday plan.
This video is for information/education purpose only. you are 100% responsible for any actions you take by reading/viewing this post.
please consult your financial advisor before taking any action.
----Vinaykumar hiremath, CMT


ZEEL Long Fundamentals look good
even though the stock was in a long term bearish move, we might capture a small percentage based on technicals.

Zee to possibly form a bottomIn hindsight it was clear where Zee share wanted to go....45-46 should be a logical location where major buyers should step in, provided there is some catalyst for the stock.....But considering the current market environment, it could consolidate here for God knows how long.....Bearish moves are fast and quick, bullish moves take a long time as everyone is scared to buy....even though markets eventually go up, bulls tend to freak out quick and take time build and base and achieve momentum....In case of stocks....by the time it decides to reverse, you will either celebrating your grandchild's 5th birthday or you could be dead....In either case, I have started buying here and will average down....Multiple sell targets till 600.....Very very long term hold....

ZEEL Reversal from strong supportWhenever a stock is trading at strong support, there are high chances of a reversal, which gives us a great risk-reward (RR) opportunity.
In this case, the RR is 1:5 and can be trailed if the idea works out further.
For a successful breakdown(SL), we should ideally see a strong 1Month candle on our chart—it’s crucial to use that timeframe.
Following the breakdown, the ideal exit point would be after a consecutive candle that breaks below the breakdown candle
As always, remember to do your own research before making any investment decisions!

ZEEL or no ZEAL? Zee Entertainment has been a very old trading stock of punters. Since the Sony debacle, this stock has been re-rated negatively. The governance issues are being sighted as a cause for the continuous selling. Domestic mutual fund houses have reduced positions by almost 3.3 percent in last quarter. The number of Foreign institutions holding it has also reduced. It looks cheap when you see the chart and its high and lows. But beware! Even at this low price, it has a PE which is at par of its competition. Reliance-Disney deal has also dealt a big blow.
Technically it has made a double bottom . The resistance lines are marked in chart for your reference. Keep it in your watchlist. A small bounce is also likely. This can be used as a trading opportunity. But for long term, the trend needs to be reversed before taking any positions.
This is not a buy/sell recommendation.
This post is only for educational purpose.
Kindly consult your financial advisor before investing.
Keep strict stoploss and money management rules.
Happy Trading!!

ZEEL MAKING BOTTOMZEEL looks promising for a 40% return
CMP - 123
Tgt 1 - 169 Tgt 2 - 209
SL 105 on Monthly closing basis as the round number 100 might offer greater turning point as well
Stock making double bottom at the lower trendline of the parallel channel
Immediate tgt can be 169 and max tgt at 209 for 2025
May not be a momentum stock and might test our patience but looks promising
Disclaimer: I am not a SEBI registered advisor. This idea is purely for educational/information purposes only and does not constitute trading idea

Zee long term target 630elliot wave analysis zee tv chart complete impulse wave structure and start corrective wave . Corrective Wave internal a,b or C .

Zee Entertainment Enterprises LimitedZee Entertainment Enterprises Limited
As per candlestick law odd number candle make opposite pressure.
Past 7 months trading in the same range 125 to 165.
All 4 red colour candles are
looking good to push the price up
Risky entry - Current price levels
Entry - Above 150 is safe
SL - At current low's(125)
Target - 50% + + in monthly view

Entered ZEEL @135 SL 114TRADE: Have Entered ZEEL@137 sl 114 with Half Risk..
REASON TO TRADE: Has taken support in 2020 and taken off at these prices in 2012 and hence expecting reversal from here.
DEFINED SL@ 114.

ZEEL S/RSupport and Resistance Levels:
Support Levels: These are price points (green line/shade) where a downward trend may be halted due to a concentration of buying interest. Imagine them as a safety net where buyers step in, preventing further decline.
Resistance Levels: Conversely, resistance levels (red line/shade) are where upward trends might stall due to increased selling interest. They act like a ceiling where sellers come in to push prices down.
Breakouts:
Bullish Breakout: When the price moves above resistance, it often indicates strong buying interest and the potential for a continued uptrend. Traders may view this as a signal to buy or hold.
Bearish Breakout: When the price falls below support, it can signal strong selling interest and the potential for a continued downtrend. Traders might see this as a cue to sell or avoid buying.
20 EMA (Exponential Moving Average):
Above 20 EMA(50 EMA): If the stock price is above the 20 EMA, it suggests a potential uptrend or bullish momentum.
Below 20 EMA: If the stock price is below the 20 EMA, it indicates a potential downtrend or bearish momentum.
Trendline: A trendline is a straight line drawn on a chart to represent the general direction of a data point set.
Uptrend Line: Drawn by connecting the lows in an upward trend. Indicates that the price is moving higher over time. Acts as a support level, where prices tend to bounce upward.
Downtrend Line: Drawn by connecting the highs in a downward trend. Indicates that the price is moving lower over time. It acts as a resistance level, where prices tend to drop.
RSI: RSI readings greater than the 70 level are overbought territory, and RSI readings lower than the 30 level are considered oversold territory.
Combining RSI with Support and Resistance:
Support Level: This is a price level where a stock tends to find buying interest, preventing it from falling further. If RSI is showing an oversold condition (below 30) and the price is near or at a strong support level, it could be a good buy signal.
Resistance Level: This is a price level where a stock tends to find selling interest, preventing it from rising further. If RSI is showing an overbought condition (above 70) and the price is near or at a strong resistance level, it could be a signal to sell or short the asset.
Disclaimer:
I am not a SEBI registered. The information provided here is for learning purposes only and should not be interpreted as financial advice. Consider the broader market context and consult with a qualified financial advisor before making investment decisions.

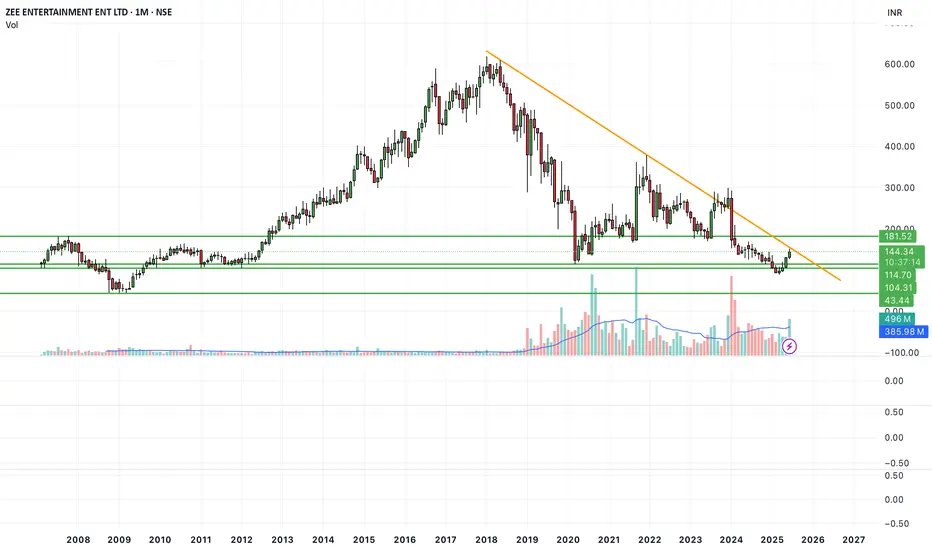
Unlocking the Technical Tapestry of ZEELAs we delve into the intricate world of stock market charts, ZEEL presents an intriguing case study in its daily trading canvas. A descending trendline dominates the landscape, artfully connecting lower highs and painting a picture of restraint in bullish momentum. This pattern suggests that sellers have consistently entered at lower price points, applying downward pressure on each attempted rally.
Beneath this overarching theme lies a battleground marked by trend line representing key support and resistance levels. This line is testament to the tug-of-war between buyers holding ground and sellers pushing back, encapsulating zones where significant transactions have historically occurred.
Amidst this struggle for supremacy, volume bars stand tall like sentinels at the bottom of our view, their peaks and troughs offering clues about trading intensity at various price points. A surge in volume accompanying price movements can often signal strength behind those moves.
Complementing our visual saga is a unique application of technical analysis: MACD applied to OBV (On-Balance Volume). This combination provides a nuanced view of momentum and volume flow. The MACD on OBV helps traders identify shifts in buying and selling pressure, offering a deeper insight into the underlying strength of price movements. When the MACD line crosses above the signal line on OBV, it can indicate increasing buying pressure, while a cross below may suggest rising selling pressure.
In summary, ZEEL’s current technical setup paints a cautious tale with bearish undertones as evidenced by its descending trendline. However, within this framework lies opportunities – moments where support holds firm or resistance gives way could signal pivotal shifts worthy of an investor’s gaze.

Zee entertainmentheavy accumulation happen, RSI divergence.
Elliott wave and harmonic pattern are technical conformation
Stock fundamental worst ,so no fundamental.
Cmp-134
200/around next strong resistance

Turnaround Story - Zee LtdZee ltd is trading at 2020s COVID lows. There have been some positive developments in this company in last one week, where sony dropped all charges and allegation which impact Sony Zee Merger. Although Merger is off the table but dropping of charges is also big relief for the company.
Company has given signs of reversal from demand zone and also breakout and retest is done of downward trendline. Looking to enter in this stock in parts because this can be risky trade.
This view will be neglected once the stock breaches demand zone.
Keep Strict SL, Buy Quantity as per your risk capacity.
Happy Investing..

ZEEL LEVELS FOR SWING TRADING 18/06/2024STOCKS FOR SWING TRADING (SHORT TERM) 18/06/2024
NO.7
#ZEEL
Buy Price - 160 (CMP 164)
SL - 125
TARGET - 205, 230, 250 (25 - 40 - 55%)
@jagadheeshjp
Disclaimer : All information on this page is for educational purposes only,
we are not SEBI Registered, Please consult a SEBI registered financial advisor for your financial matters before investing And taking any decision. We are not responsible for any profit/loss you made.


Zeel can be bought for a swing up to 175 in 1-2 days.Zeel trading above 160. Can be bought for a target of 175 in 1-2 days.

ZEE EntertainIntroducing Algo Premium Technical Indicators for insightful analysis! 📈
Projected: ZEE Entertain may hit 126.5 levels soon,
After filling 126.5 FVG, Trend forecast signaling a potential uptrend towards 168, 186, 230 & 277 levels by May 2024.
Enhance your trading strategy with our Premium Technical Indicators:
1. Intraday Indicator
2. Algo Price Action
3. Magic SR Indicator
4. Magic Support and Resistance Block Detector
5. Centre Pivot Range
6. FVG Imbalance Tracing
Make informed decisions for successful trades! Start now at www.paidindicators.com 🚀 #HappyTrading #AlgoIndicators

FALL & RISE OF ZEE ?Hi,
Firstly the chart of the ZEE had given breakout yesterday from a falling pattern and today it gave a confirmation by forming a green candle & with a positive news of profit in the QTR
So as per chart it's a clear buy signal and what my suggestion is to buy and ride the bull run with a strict stop loss there is possibility that from here it can easily give 20% or much more than that not giving any target still anybody wants do comment.
Observe CAMPUS stock too will maybe share an analysis tomorrow.
**** This are all my views and thoughts not any recommendations****

[Positional] Zeel Buy IdeaNote -
One of the best forms of Price Action is to not try to predict at all. Instead of that, ACT on the price. So, this chart tells at "where" to act in "what direction. Unless it triggers, like, let's say the candle doesn't break the level which says "Buy if it breaks", You should not buy at all.
=======
I use shorthands for my trades.
"Positional" - means You can carry these positions and I do not see sharp volatility ahead. (I tally upcoming events and many small kinds of stuff to my own tiny capacity.)
"Intraday" -means You must close this position at any cost by the end of the day.
"Theta" , "Bounce" , "3BB" or "Entropy" - My own systems.
=======
I won't personally follow any rules. If I "think" (It is never gut feel. It is always some reason.) the trade is wrong, I may take reverse trade. I may carry forward an intraday position. What is meant here - You shouldn't follow me because I may miss updating. You should follow the system I share.
=======
Like -
Always follow a stop loss.
In the case of Intraday trades, it is mostly the "Day's High".
In the case of Positional trades, it is mostly the previous swings.
I do not use Stop Loss most of the time. But I manage my risk with options as I do most of the trades using derivatives
