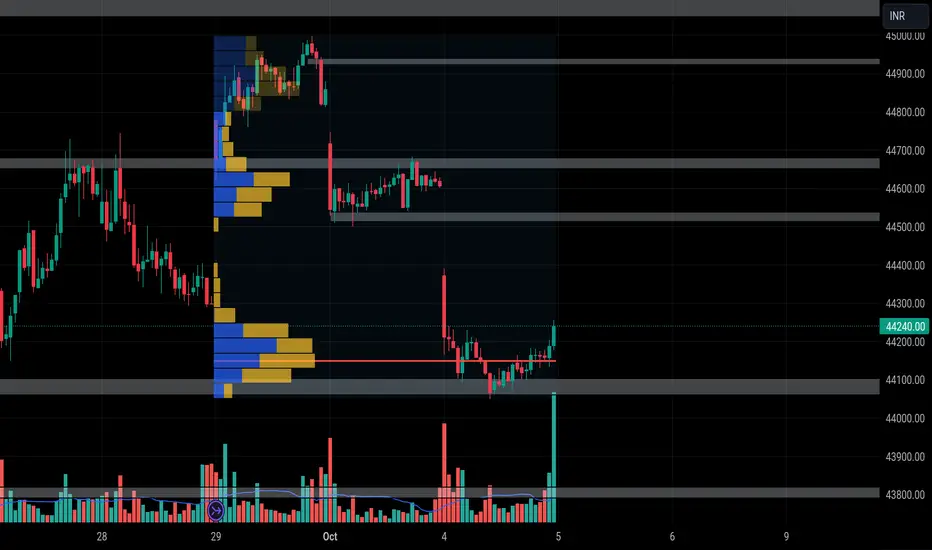
Mkt Bearish. 39950 a possibility in futures of Banknifty44500 support is broken. Market structure now broken and has entered BEARISH territory. Following are the levels expected 43956/43800/43500/43385. If the last support is taken away then we will be looking at 42650 and 39950.
IMP Levels to watch out are 43400 and 42600 before touching 39950
BANKNIFTY1! trade ideas

Review and plan for 5th OctoberNifty future and banknifty future analysis and intraday plan in kannada.
This video is for information/education purpose only. you are 100% responsible for any actions you take by reading/viewing this post.
please consult your financial advisor before taking any action.
----Vinaykumar hiremath, CMT

BANKNIFTYPlease, please, please only create and share content that's unique to you and you alone. Don't copy or use someone else's content without asking for permission first and crediting them. Make sure you've got the legal rights to reuse content. Just like in school, plagiarism will result in detention, suspension, and even expulsion.
BANKNIFTYWelcome to TradingView, the largest home of traders and investors anywhere in the world. As you can imagine, managing a community of millions and millions of people requires some thoughtful rules and regs to ensure total chaos doesn't spread faster than a fart in a submarine. These laws apply to everyone, including you, and are here to encourage friendly and respectful behavior, facilitate healthy discussion and debate and — most importantly — protect our users from harm.
If you've signed up, then you've already agreed to abide by these rules. Don't ignore them. Instead, help us to create a collaborative environment where all traders are welcome. Let's build, not break things, people.
The Rules

Review and plan for 3rd October 2023Nifty future and banknifty future analysis and intraday plan in kannada.
This video is for information/education purpose only. you are 100% responsible for any actions you take by reading/viewing this post.
please consult your financial advisor before taking any action.
----Vinaykumar hiremath, CMT

BANKNIFTYBANKNIFTY closed below va
1. gapup 44950 can long till 45100
2. flat opening 44950-44650 will wait for reaction at these zones
3. gap down 44650 can short till can short till 44300

Comprehensive Approach to Options Writing - Maximizing PremiumsComprehensive Approach to BANKNIFTY Options Writing - Maximizing Premiums
Introduction:
In this trading idea, we'll explore a strategy for writing both out-of-the-money (OTM) and in-the-money (ITM) put and call options in the BANKNIFTY index. This strategy aims to take advantage of time decay and market conditions to generate consistent income.
Objective:
The primary objective of this strategy is to collect premiums by selling options, taking advantage of time decay, and managing risk effectively. It involves writing OTM and ITM options to accommodate different market scenarios.
Strategy Components:
Out-of-the-Money (OTM) Option Writing:
Call Options: When the market is in a stable or bullish trend, consider writing OTM call options. This strategy generates income as long as the market remains below the strike price of the call options. If the market rises sharply, you may be assigned, so it's crucial to have a plan in place to handle such situations.
Put Options: In a stable or bearish market, write OTM put options. This generates income as long as the market stays above the strike price of the put options. Be prepared for assignment if the market falls significantly.
In-the-Money (ITM) Option Writing:
Call Options: In a strongly bearish market, you can write ITM call options. This allows you to collect higher premiums as the options have intrinsic value. However, be prepared for assignment if the market rebounds.
Put Options: When the market is strongly bullish, consider writing ITM put options. These options also offer higher premiums due to their intrinsic value. Have a plan in place to handle assignments if the market reverses.
Risk Management:
Use stop-loss orders or defined risk spreads to limit potential losses if the market moves against your positions.
Diversify your option writing across different strike prices and expirations to spread risk.
Regularly monitor market conditions and your positions to adjust as needed.
Writing both OTM and ITM put and call options in BANKNIFTY can be a profitable strategy when executed with careful consideration of market conditions and risk management. However, it requires constant monitoring and adjustment to adapt to changing market dynamics. Remember to consult with a financial advisor and perform thorough research before implementing any options trading strategy.
Now Lets Get into Real Chart Examples :
Chart Reference :
On August 16th, we initiated a strategy involving the writing of both call (CE) and put (PE) options on the BANKNIFTY index (CA.PA). We chose to write options at both the at-the-money (ATM) and in-the-money (ITM) levels.
Specifically:
For the ITM (in-the-money) call option, we selected a strike price of 44,000, which was below the current market level. This means the call option had intrinsic value due to its position below the market price.
For the OTM (out-of-the-money) call option, we went with a strike price of 45,000, which was reasonably above the market level. This call option had no intrinsic value but had a chance to gain value if the market moved in its favor.
Regarding the ITM (in-the-money) put option, we chose a strike price of 44,000, which was above the current market level. This put option had intrinsic value as it was already in a profitable position.
Lastly, for the OTM (out-of-the-money) put option, we opted for a strike price of 43,500, which was reasonably below the ITM price of 44,000. This put option had no intrinsic value but had potential if the market moved favorably.
This approach allowed us to explore different market scenarios by combining both ITM and OTM options for both calls and puts. It's important to manage these positions carefully, considering potential assignments and market movements. Always stay vigilant and be prepared to adjust your strategy as needed based on market conditions.
On 16th Aug 2023 : (OTM)
Call price was 370 to 460,Put price was 1025 to 1178
Lets assume we enter writing 45000 CE and 43500 PE @ 400 (CE) and 1150 (PE)
Total Premium Collected is 1550 on this OTM Writing .
On 16th Aug 2023 : (ATM/ Near ITM)
Lets assume we enter Writing 44000 ITM CE and PE @ 1000 and 600 respectively
Now each day due to time decay and since we had taken both strangle and straddle together .There will be a balance of this strategy even if the price moves between 43500 to 45000.
Only when the price goes beyond this range we need to adjust for making sure to get the win of this stragtegy .
Withing the entry price range if the market moves .This will be to our favour .
Lookout the DailyPnl Chart below of 45000 CE and 43500 PE that shows the outcome of this Entry on 1.Day the position taken 2. on worst day of market move 3. On Expiry day
and here is the outcome of 44000 ITM CE and PE on 1.Day the position taken 2. on worst day of market move 3. On Expiry day
This clearly shows even if the market move violently we shall easily adjust this and get out the strategy with decent win outcome .
Please write your inputs in the comment on your take of this strategy or if you have better learning about option writing .
Reference of Entry and Expiry and how the ATM and ITM position .Here we did not use any indicator for entry .With indicator we can position well the ATM ITM CE PE writing entries with informed decision by the Indicator.
Thanks and Reading .

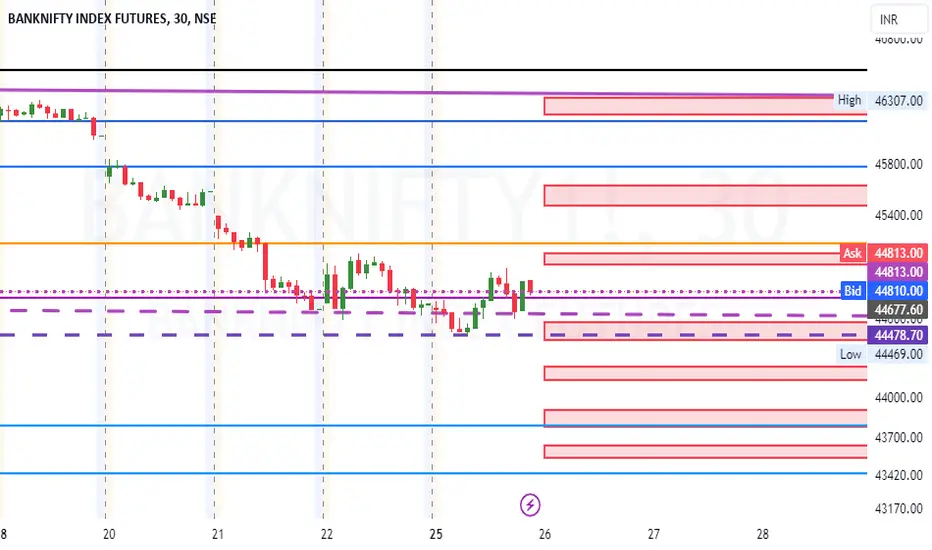
BNK Levels This is for swing trade levels .....
take position based on this level with smaller TF reversal on your view ......
Octafx copy trade : BidaskeyTraders
Note:
This isn't financial advice, (not a buy or sell signal). This is for based on my knowledge and my risk management . Before following any ideas, do your own research and practice good risk management.
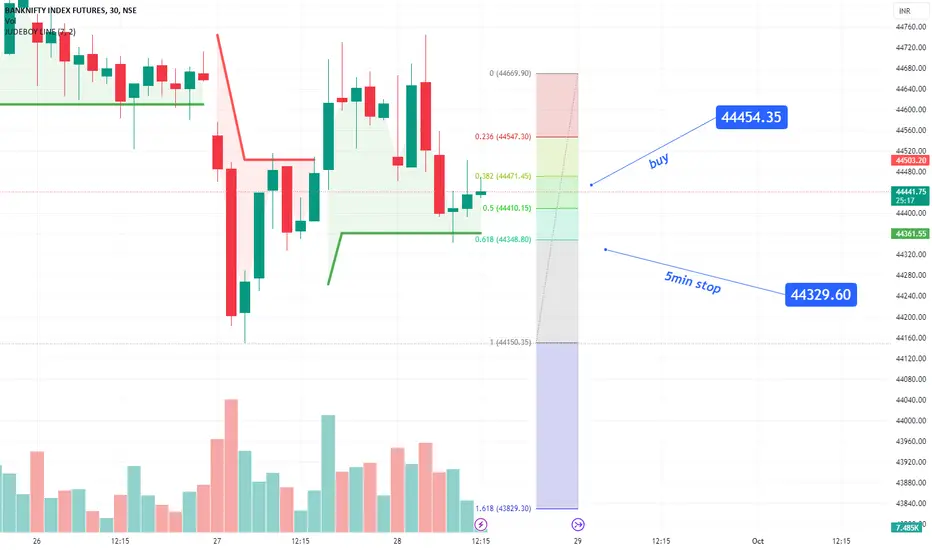
Bank nifty looks good on a positive opening on tuesdaybank nifty has closed with good volumes at a good support zone on the chart & RSI , can expect a 200+ point move on the bank nifty and is looking good for a target of 46000

Red expiry!!- plan for 29th September 2023Nifty future and banknifty future analysis and intraday plan in kannada.
This video is for information/education purpose only. you are 100% responsible for any actions you take by reading/viewing this post.
please consult your financial advisor before taking any action.
----Vinaykumar hiremath, CMT

BANKNIFTYBANKNIFTY closed inside va
1. gapup 44500 can long till 44700
2. flat opening 44500-44300 will wait for reaction at these zones
3. gap down 44300 can short till 44100

Mkt major Support broken. Officially entered BEARISH Territory44500 support is broken. Market structure now broken and has entered BEARISH territory. Following are the levels expected 43956/43800/43500/43385. If the last support is taken away then we will be looking at 42650

BANKNIFTYBANKNIFTY closed above va
1. gap up 44800 can long till 45000
2. flat opening 44800-44300 will wait for reaction at these zones
3. gap down 44300 can short till 44000

BANKNIFTY BANKNIFTY closed inside va
1. gapup 44800 can long till 45000
2. flat opening 44800-44500 wait for reacvtion at these zones
3. gap down 44500 can short till 44000

Review and Trading plan for 26th September 2023Nifty future and banknifty future analysis and intraday plan in kannada.
This video is for information/education purpose only. you are 100% responsible for any actions you take by reading/viewing this post.
please consult your financial advisor before taking any action.
----Vinaykumar hiremath, CMT

BANKNIFTY INTRADAY PREDICTED LEVELS FOR 26 SEP 2023Bank Nifty Predictions for Intraday Players, these levels are only valid for one single day, which is 26th Sep 2023, and only for the educational purpose only.
I have marked all the levels on the upside and downside on the Intraday Charts, which anyone can see easily.
Bull Zone Means Buying Above Once Any 5 Min Candle Give Closure Above that Level and Bear Zone Means Selling Only, If Any 5 Min Candle Get Closed Below Bear Zone.
All the predictions are only for testing purposes, and for paper trading only.
Disclaimer : Please consult with your financial advisor before taking any real trade in the live market.

BANKNIFTYBANKNIFTY closed inside va
1. gapup 45100 can long till 45400
2. flat opening 45100-44500 will wait for price reaction at these zones
3. gapdown 44500 can short till 44100
Banknifty Setup towards the Sellside LiquidityBanknifty Sellside setup on a 15 min time frame with the order flow using premium and discount

No trade day! Plan for 25th September 2023Nifty future and banknifty future analysis and intraday plan in kannada.
This video is for information/education purpose only. you are 100% responsible for any actions you take by reading/viewing this post.
please consult your financial advisor before taking any action.
----Vinaykumar hiremath, CMT

Nifty and Bank Nifty Market Commentary plus Importance of timeUpcoming market moves for the Nifty and Bank Nifty along with learning the concept and Importance of time before price. So We always have to Consider Time as the first element of trading then we have to look for the trading setups

BANKNIFTYBANKNIFTY closed inside va
1. gapup 44850 can long till 45100
2. flat opening 44850-44500 will wait for price reaction at these zones
3. gap down 44500 can short till 44100

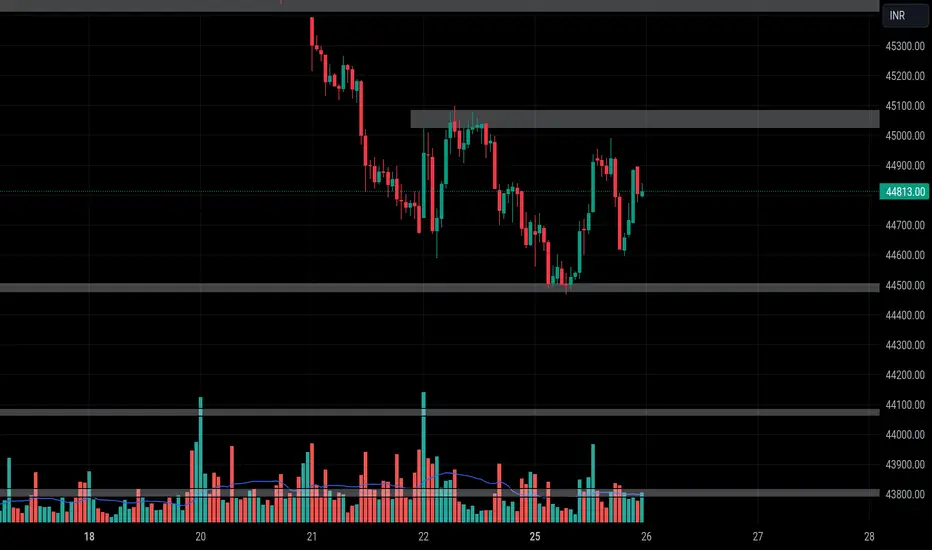
BNF (fut) at a very critical JunctureToday candle i.e. Sept 22nd 2023 will decide if we will take support from 44500/44200 levels and reverse or if markets will fall further. The likely support are 44500/44200/44000/43950. Mkt can take support from any of the above levels most likely at 44500 itself. Last support is at 43950. All levels are futures .
