NIFTYNifty levels are based on imbala nces
1. gapup 23480 long
2. 23450-23300 trade breakout
3. gapdown 23300 short
NIFTY1! trade ideas

Expected Nifty Stabilisation on the downsideNifty is expected to stabilize on the downside levels at daily chart 21830-22078.

NIFTYNifty levels are based on imbalances
1. gapup 23250 long
2. 23250-23150 trade breakout
3. gapdown 23150 short

NIFTYNifty levels are based on imbalances
1. gapup 23000 long
2. 23000-22930 trade breakout
3. gapdown 22930 short

@ CrossroadsGift Nifty:
The index is at crossroads and waiting for a clear decision to be taken.
Its so far not clear who will keep going bulls or bears.

NIFTYNifty levels are based on imbalances
1. gapup 22980 wait for retracement
2. 22980-22840 trade reversal
3. gapdown 22840 short

Today Range for Nifty Watch n catch both range buy n sell
level givan. Do as per your financial advisor

NIFTYNifty levels are based on imbalances
1. gapup 22650 long
2. 22650-22500 trade breakout
3. gapdown 22500 shoert

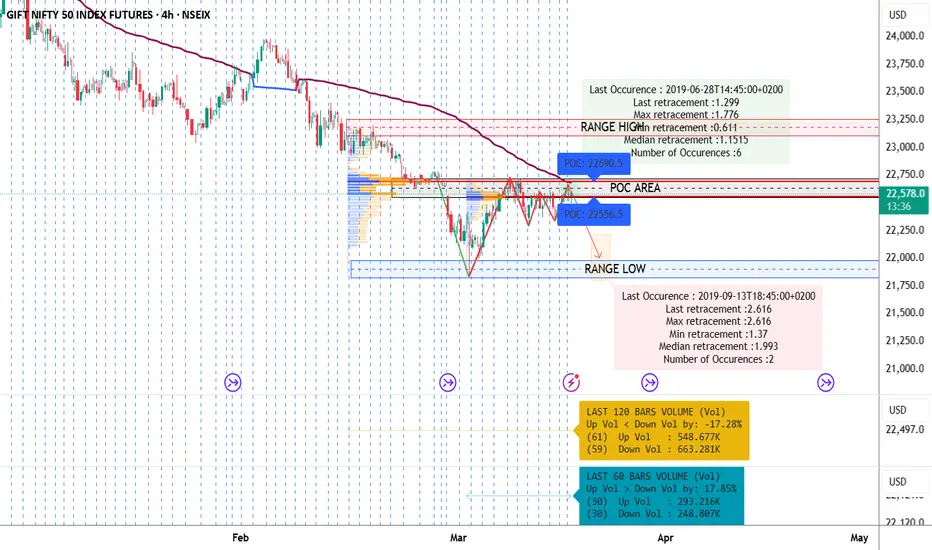
Technical Analysis for GIFT Nifty 50 Futures (4-Hour Chart)Trend Identification
The 4-hour chart of GIFT Nifty 50 Index Futures shows a shifting trend to the upside. After a period of consolidation in a mild downtrend, prices have broken out above a prior descending channel, indicating a potential trend reversal into bullish territory
. The breakout has pushed the price above short-term moving averages (e.g. the 20 and 50-period EMAs), which have started to turn upward, reflecting improving bullish momentum. Meanwhile, momentum indicators support this shift: the RSI has climbed from bearish lows toward the 50-60 range, and the MACD on 4H has crossed above its signal line, all signifying strengthening upward momentum. Overall, the prevailing bias appears bullish, though confirmation above key resistance is still required for the uptrend to firmly establish itself.
Key Support and Resistance Levels
Multiple crucial price levels can be identified from recent price action and volume distribution:
Immediate Support – 22,300–22,400 Zone: This region marks the top of the previous consolidation and coincides with a high-volume area on the volume profile. In fact, 22,350–22,400 appears to be a recent Point of Control (POC) where trading volume was heaviest, indicating strong acceptance of price in that range. The last session closed near 22,397, reinforcing this area’s importance
ENRICHMONEY.IN
. As long as the price remains above ~22,300, bulls are likely to defend this zone. A drop below 22,300 would be concerning, as it could invalidate the bullish breakout and trigger further downside pressure
Immediate Resistance – 22,650: On the upside, 22,650 stands out as a key resistance level. This level represents the prior swing high and the upper bound of the broken channel. Notably, analysts note that upward momentum will only sustain if the price holds above ~22,650
. This implies that 22,650 is a threshold for confirming the uptrend – a successful 4H close above this level would signal a breakout continuation.
Near-Term Levels – 22,480 and 22,410: In intraday action, 22,480 (approx.) has acted as an interim resistance turned support after this morning’s positive gap-up, while 22,410 was a minor intraday support level. These finer levels can serve as pivots for very short-term traders – for instance, moves above 22,480 tend to invite additional buying, whereas slips below 22,410 could introduce intra-day weakness
. They frame the immediate trading range within the larger support/resistance context.
Higher Resistance Targets – 23,000+: If 22,650 is decisively cleared, the next psychological level to watch would be 23,000, which is not only a round number but also near previous multi-week highs. Some bullish projections (e.g. from Elliott Wave analysis) even suggest an extended move toward 23,500–23,800 in an optimistic scenario
. However, those higher levels would likely only come into play if the current trend accelerates and global sentiment remains strong.
Lower Support – 22,000 and Below: Conversely, failure to hold 22,300 support could see the futures retrace toward the 22,000 mark, a psychologically important round-number support. Below that, recent swing lows in early March around 21,800–21,900 would be the next support zone to monitor, and a breach there might signal a deeper correction is underway.
Chart Patterns and Setups
The recent price action is characterized by a few notable chart patterns:
Channel Breakout: The most significant pattern is the aforementioned breakout from a downward-sloping channel. Throughout late February and early March, price was confined in a gentle downtrend channel, making lower highs and lower lows. Last week, the market formed a base and punched above the channel’s upper trendline, indicating a bullish reversal of that corrective trend
. This breakout suggests the end of the pullback and a possible resumption of the larger uptrend (if we consider the longer-term trend still up). Traders often see such channel breakouts as continuation setups when they occur in the context of a larger primary uptrend, or as reversal setups if the prior trend was down. Here it appears to be a reversal of the short-term downtrend and a continuation of the longer-term bullish trend.
Retest and Flag Formation: After the initial breakout, price has been consolidating just under the 22,650 resistance. This consolidation, so far relatively tight, could be forming a bullish flag or pennant on the 4H chart. Such a pattern represents a pause after the strong move up – typically volume contracts during the formation of the flag. If volume remains light and price holds in a narrow range beneath resistance, it increases the probability of an upside breakout continuation. A 4H candle closing above 22,650 on strong volume would confirm the flag breakout and likely trigger a fresh leg higher.
Potential Double-Top/Failure Pattern: It’s worth noting a caveat – if the price repeatedly fails to overcome 22,650 and starts turning down, it could establish a double-top relative to a previous high (if one was made around this level in recent sessions). A reversal pattern like that would be confirmed if price then breaks below the interim support (22,300). In that bearish case, the bulls’ failure to breakout would invite sellers, possibly leading to a sharper decline. As of now, there’s no confirmed double-top, but it’s a pattern to monitor if bullish momentum falters at resistance.
Volume Analysis
Volume dynamics play a critical role in validating price movements on the futures chart:
Rising Volume on Advances: The breakout from the channel was accompanied by a surge in buying volume, indicating that buyers showed conviction when the price moved above resistance. Healthy uptrends often see volume expanding on rallies; this appears to be the case as the current upswing kicked off. If we look at the volume bars during the push from ~22,300 to 22,600, there was a notable increase compared to the preceding quiet period, reflecting strong demand. This increased volume adds credibility to the breakout’s legitimacy.
Lighter Volume on Pullbacks: Following the gap-up and initial rally earlier today, volume has tapered off during the mid-day consolidation. This is a positive sign for bulls – declining volume on minor pullbacks or sideways moves implies that selling pressure is not aggressive. It suggests that most traders are not rushing for the exits; instead, many are holding positions, waiting for potentially higher levels. Such volume behavior (high on rallies, lower on dips) is characteristic of an accumulation phase supporting the uptrend.
Volume Profile & Point of Control (POC): Analyzing the volume profile for recent sessions, the Point of Control (POC) – the price level with the highest traded volume – lies in the mid-22,300s (roughly around 22,350). This makes sense as the market spent a lot of time and volume in that area during the prior consolidation. The POC can act as a magnet and a support zone; with price now above it, that high-volume price is likely to provide support on any dips (many positions were established there, so traders may defend it). If the price were to fall back under the POC, that level could flip into resistance. Additionally, the volume profile shows a lighter volume area above ~22,650-22,700, which means if the price breaks out above resistance, it might move relatively quickly (air pocket in volume) until the next high-volume node (perhaps around 23,000).
Watching Volume at Key Levels: It’s important to watch how volume behaves as price approaches major support or resistance. A spike in volume on a breakout above 22,650 would confirm buyers are overwhelming that supply zone. Conversely, if an attempted breakout above 22,650 comes on low volume, it could be a false breakout. Similarly, if price tests 22,300 support, heavy sell volume would warn of a breakdown, whereas modest volume on a dip might indicate lack of conviction from sellers.
Trade Setups – Bullish and Bearish Scenarios
Based on the above technical factors, here are two trade scenarios – one bullish and one bearish – complete with entry, stop-loss, targets, and thoughts on position sizing (assuming a medium-term trade on the 4H timeframe):
📈 Bullish Trade Setup
Scenario: The uptrend continues – either via a breakout above resistance or a pullback entry that holds support.
Entry Point: Consider a long entry either on a confirmed breakout above 22,650 or on a dip to the support zone around 22,400.
Breakout Entry: If a 4H candle closes above 22,650 (with strong volume), that’s a signal to buy into the bullish continuation. One might enter around 22,660–22,700 on the breakout momentum.
Pullback Entry: If the price retraces first, an entry in the 22,350–22,450 area could be taken, provided there are signs of support (e.g. bullish reversal candlesticks or volume picking up at that POC region). This allows buying near support with a tighter stop.
Stop-Loss Placement: To manage risk, place a stop-loss below the next key support. For a breakout entry, a logical stop could be just below ~22,600 (the broken resistance), say around 22,500 – if the breakout is real, price shouldn’t dip back far below the old resistance. For a pullback entry at 22,400, a stop below 22,300 makes sense, as a break under 22,300 would invalidate the bullish thesis
. These stop levels ensure that if the trade premise is wrong, losses are cut quickly (approximately 150–200 points risk from entry).
Target Levels:
First target around 23,000, which is a round number and roughly the measured move equal to the channel’s depth added to the breakout point. If entering at ~22,650, this gives about +350 points potential, aligning with a 1.5:1 to 2:1 reward-to-risk depending on stop placement.
Second target near 23,300–23,500 for an extended move. This region aligns with the next major supply zone and some optimistic wave projections
. Hitting ~23,300 would yield ~650-700 points profit from a 22,650 entry (an attractive ~3:1 reward-to-risk). Traders can scale out: e.g., book partial profits at 23,000 and let the rest ride towards the higher target with a trailing stop.
Position Sizing & R:R: Proper position sizing is crucial. For example, if one’s stop is ~150 points away, and they’re willing to risk 1% of capital on the trade, they should size the position such that 150 points equals 1% of the account. In practical terms, if trading one lot of GIFT Nifty has a certain notional value per point, calculate how many lots or contracts equate to ~1% loss when moved 150 points. Ensuring at least a 1:2 Risk-to-Reward (R:R) ratio (risking 150 points to make 300+ points) helps maintain a positive expectancy. In this bullish setup, the R:R is approximately 1:2 to 1:3, which is favorable.
📉 Bearish Trade Setup
Scenario: The resistance holds and the recent bullish attempt fails – leading to a downside move. This could happen if global sentiment sours or if the index cannot sustain above support.
Entry Point: A short entry could be considered if we see a rejection at the 22,650–22,700 resistance area or a breakdown below support.
Reversal Entry (Aggressive): If the price spikes up toward 22,650/22,700 but then prints a bearish reversal pattern (e.g., a shooting star or bearish engulfing candle on the 4H) on low volume, it may indicate a bull trap. One could initiate a short around 22,600–22,650 on this failed breakout attempt.
Breakdown Entry (Conservative): Alternatively, wait for confirmation of weakness by letting price break below the key 22,300 support. A short entry in the 22,250–22,300 zone on the breakdown, after a 4H close under 22,300, would align with momentum turning bearish. This ensures the bearish trend is underway before entering.
Stop-Loss Placement: For a short from the resistance area, the stop-loss should be placed above the recent swing high – for instance, around 22,800 (just above the 22,650 resistance and any intraday spikes). If using the breakdown entry below 22,300, a stop just back above 22,300 (say 22,400) is prudent – if price climbs back into the prior range, the breakdown was false. These stops might equate to roughly 150–200 points risk. The idea is to exit quickly if the bearish scenario is invalidated (either by a new high or by regaining broken support).
Target Levels:
First downside target could be around 22,000, the psychological support. This is roughly 300 points from a 22,300 breakdown entry (reward ~300 vs risk ~100-150, yielding about 2:1 R:R). From a 22,600 entry, 22,000 would be ~600 points gain (with ~150-200 risk, that’s about 3:1 R:R).
A secondary target might be the 21,800 region (early-March lows) or even 21,500 if bearish momentum accelerates. These levels correspond to deeper supports; reaching 21,800 from a 22,600 entry is ~800 points reward (~4:1 R:R). Traders should consider trailing stops as price approaches 22,000, protecting profits while aiming for these extended targets in case of a larger correction.
Position Sizing & R:R: Similar to the bullish case, calculate your position so that the distance to your stop (e.g., 200 points) represents only a small percentage of your capital (commonly 1% or less). That way, a losing trade does limited damage. The bearish setups outlined have potential R:R ratios in the 2:1 to 4:1 range, which are attractive. But these assume disciplined execution of stops – never hold onto a losing short beyond your stop, as an uptrend can quickly squeeze shorts. Proper sizing and adherence to the stop is vital, especially given that short trades, in a generally bullish market, carry the risk of sharp reversals.
Risk Management Considerations
Regardless of the trade direction, robust risk management is non-negotiable:
Capital Allocation: Limit exposure on any single trade. As a rule of thumb, risking about 1-2% of your trading capital per trade is common practice. This means position size is adjusted so that if your stop-loss is hit, the loss is only 1-2% of your account. Such prudent sizing prevents a single bad trade from significantly denting your portfolio.
Use of Stop-Loss Orders: Always employ stop-loss orders as outlined in the setups – and resist the temptation to widen the stop if price moves against you. Define the invalidation point for your trade idea in advance (e.g., key support/resistance breach) and stick to it. This discipline protects you from hoping the market comes back in your favor while losses mount.
Take Profit & Trailing Stops: It’s wise to take partial profits at interim targets. For the bullish trade, one might book some profits near 23,000 and move the stop-loss up to breakeven on the remainder. For the bearish trade, perhaps secure some gains around 22,000 and lower the stop accordingly. Trailing stops can be effective in a trending move – they allow profits to run while locking in gains as the market moves favorably. For instance, using a trailing stop just above each lower high in a short trade, or below each higher low in a long trade.
Risk/Reward Evaluation: Before entering, evaluate the risk-to-reward ratio. The goal is to take trades where the potential reward is at least twice the risk (R:R ≥ 2:1). This ensures that even if you win only half of your trades, you remain profitable overall. In the setups above, we outlined scenarios aiming for roughly 3:1 R:R, which provides a cushion for the inevitable losing trades. Avoid trades where upside is limited but downside risk is large.
Avoid Over-Leveraging: Futures inherently carry leverage. It’s critical not to over-leverage your position. Even if a setup looks extremely promising, maintain discipline in position sizing. Over-leveraging can lead to forced liquidations on minor adverse moves, taking you out of the trade prematurely or, worse, causing outsized losses.
Emotional Discipline: Stick to the trading plan. It’s easy to get swayed by emotions (fear or greed) in fast-moving markets. For example, if in a long trade and price surges to 22,900, greed might tempt one to hold for 23,500 without taking any profit; but a sudden reversal could wipe unrealized gains. Have pre-defined rules for booking profits and don’t let FOMO or panic dictate decisions. Similarly, if the market triggers your stop, accept the loss and step aside; don’t revenge-trade immediately. Maintaining this discipline is key to long-term success.
Review and Adjust: After any trade, win or lose, review the outcome. If certain risk rules were violated or if new information changes the market outlook (e.g. a surprise rate hike), adjust your strategy accordingly. Continuous learning and adaptation is part of risk management too, ensuring that each trade’s lessons inform future decisions.
Geopolitical & Fundamental Factors
While technicals provide the trade setup, broader macroeconomic and geopolitical context is crucial for a complete picture. Currently, several external factors are influencing market sentiment for GIFT Nifty 50 futures:
Global Market Sentiment: The overall tone in global equity markets has been optimistic recently. Key drivers include cooling inflation data and expectations that major central banks, especially the U.S. Federal Reserve, may pause or even cut interest rates in upcoming meetings
. Easing inflationary pressures give central banks room to be less aggressive, which in turn is positive for equities and other risk assets. This optimism from U.S. and Asian markets has helped GIFT Nifty gap up and trade strong, as it often takes cues from overnight global developments.
Interest Rate Policies: Traders are closely watching central bank policies. In the U.S., if the Fed signals a softer stance, emerging market equities like India’s tend to attract more funds (as higher U.S. rates had been drawing capital away). Conversely, any hawkish surprise from the Fed (e.g., an unexpected rate hike or a stern inflation warning) could spook the markets and lead to a risk-off move. On the domestic front, the Reserve Bank of India’s policy remains important too – though currently the RBI’s measures and a stable USD/INR (around ₹86.9 per USD) have provided stability
. A stable rupee and liquidity support by RBI can buffer Indian markets against global volatility to some extent.
Economic Outlook: India’s fundamental story appears robust, with strong growth projections. Recent analyses by global institutions bolster long-term confidence – e.g., Morgan Stanley projects India to become the world’s third-largest economy by 2028, given its current growth trajectory
. Such bullish long-term outlooks can improve investor sentiment and willingness to “buy the dip” on any near-term market corrections. While this is more of a long-term backdrop than a short-term trading signal, it reinforces the bullish bias for India’s equity indices over time.
Geopolitical Risks: On the flip side, geopolitical tensions and global risks remain a factor. The overhang of issues like the U.S.–China trade war continues – recent data suggests tariffs have not drastically reduced Chinese exports but changed trade routes (goods finding other ways to the U.S.)
. This indicates trade frictions are persistent, which could flare up and affect global markets. Additionally, any news on geopolitical conflicts (for instance, if any escalation occurs in regions of conflict or new disputes emerge) could rapidly shift market sentiment to risk-off. Traders should keep an eye on newswires for developments such as peace talks, sanctions, or conflicts that might impact commodity prices or investor risk appetite.
Earnings and Domestic Events: We are also in an environment where corporate earnings and domestic policy decisions can influence Nifty futures. Although not immediately mentioned in technicals, if major Nifty 50 companies report earnings surprises (good or bad), it could gap the index futures accordingly. Similarly, any government policy announcements, fiscal measures, or unexpected economic data (e.g., inflation or GDP prints) could cause volatility. For instance, a significantly higher-than-expected domestic inflation print could raise fears of RBI tightening, which would be bearish for equities.
Upcoming Calendar Events: Market participants will be looking ahead to central bank meetings (such as the U.S. Fed meeting later in March 2025) and any key data releases globally. It’s important to be aware of these scheduled events – even a sound technical setup can be upended by a big surprise from an event. As a strategy, some traders avoid holding large positions during major announcements, or they hedge their positions, to mitigate event risk.
In summary, the macro context as of mid-March 2025 is cautiously positive – supportive of the bullish technical scenario – but with clear risk factors that could quickly inject volatility. By blending this fundamental awareness with the technical levels and setups, a trader can be better prepared (for example, being extra vigilant with stops around a Fed announcement, or adjusting position size if volatility is expected to jump).
NIFTYNifty levels are based on imbalances
1. gapup 22500 long
2. 22500-22380 trade breakout
3. gapdown 22380 short

Nifty Intraday Trade Plan 12/03
📉 Nifty Intraday Trade Plan 📉
🔹 Sell now in alignment with the bigger bearish trend.
🔹 Intraday targets: 22307,22280
🔹 Adding to the position if it moves above for better risk management and scaling in.
🔹 Stick to the plan and manage risk accordingly!

NIFTY Nifty levels are based on imbalances
1. gapup 22580 long
2. 22580-22480 trade breakout
3. gapdown 22480 short

NIFTYNifty levels are based on imbalances
1. gapup 22650 long
2. 22650-22480 trade breakout
3. gapdown 22480 short

NIFTYNifty levels are based on imbalances
1.. gapup 22575 long
2. 22575-22450 trade breakout
3. gapdown 22450 short

Nifty50-Viewpoint- Part 3On monthly chart, Nifty has closed below its opening levels for 5 consecutive months.
(Octber24-Feburaru,25). This also suggest that nifty might close above March opening. That means the bottom for March might be in place.
Based on these points I feel nifty might be headed towards 23500-23700 levels in March, 25 or early April,25.

Nifty Expectations Week 10th March 2025**Nifty 50 Daily Chart Analysis & Next Week's Outlook**
🔹 Trend Analysis**
- Nifty is still in a **downtrend**, trading within a **descending channel** (marked by parallel trendlines).
- Multiple **sell signals** have appeared during the decline, but a recent **buy signal** suggests a potential short-term bounce.
- The **price is currently near the lower channel support**, making this a **critical inflection point**.
🔹 Key Support & Resistance Levels**
| **Resistance 3** | **22,800 - 23,000** | Major breakout needed for bullish reversal |
| **Resistance 2** | **22,600 - 22,700** | Short-term hurdle (trendline & Fib resistance) |
| **Resistance 1** | **22,552 - 22,580** | Immediate level to watch |
| **Current Price** | **22,552** | Trying to hold above 22,500 |
| **Support 1** | **22,381 - 22,297** | Short-term support, must hold for bounce |
| **Support 2** | **22,166 - 21,806** | If broken, sharp downside towards 21,800 |
🔹 Indicators & Momentum**
1. **Trend Meter** → Still showing **weak bearish trend**, but some green bars indicate possible relief rally.
2. **ADX & Strength**:
- **ADX (Blue) is rising** → Trend strength increasing.
- **DI+ (Green) trying to cross DI- (Red/Pink)** → If successful, a short-term uptrend may start.
3. **Cumulative Delta Volume**:
- Still showing **negative cumulative delta**, meaning institutional selling is still strong.
- If buyers step in, we may see a **short-term bounce**, but it needs confirmation.
🔹 Fibonacci Retracement Zones**
- **22,600 is a key Fib level** (0.236 retracement).
- If Nifty breaks **22,600 with strong volume**, it can move toward **22,800-23,000**.
- Failure to break **22,600** could lead to another **leg down towards 22,166-21,800**.
📌 Next Week's Expected Scenarios**
| **Scenario** | **Probability** | **Key Level to Watch** |
| **Bounce towards 22,600+** | **Moderate** | Needs to stay above 22,381 |
| **Break above 22,600 → 22,800 next** | **Low-Moderate** | Needs strong volume & ADX > 25 |
| **Rejection at 22,600 → Retest of 22,297** | **High** | If selling pressure remains |
| **Break below 22,166 → Drop to 21,800** | **Possible** | If weak bounce fails |
Key Takeaways**
- **Immediate hurdle at 22,600** → Breakout needed for upside.
- **If rejected at 22,600**, Nifty may test **22,297** or even **22,166**.
- **A strong bounce can push towards 22,800-23,000**, but only if volume supports.

NIFTYNifty levels are based on imbalances
1. gapup 22720 long
2.22720-22580 trasde breakout
3. gapdown 22580 short

NIFTYNifty levels are based on imbalances
1. gapup 22650 long
2. 22650-22450 gtrade breakout
3. gapdown 22450 short

NIFTYNifty levels are based on imbalances
1. gapup 22500 long
2. 22500-22400 trade breakout
3. gapdown 22400 short

NIFTYNifty levels are based on imbalances
1. gapup 22300 long
2. 22300-22100 trade breakout
3. gapdown 22100 short

Review and plan for 5th March 2025 Nifty future and banknifty future analysis and intraday plan.
This video is for information/education purpose only. you are 100% responsible for any actions you take by reading/viewing this post.
please consult your financial advisor before taking any action.
----Vinaykumar hiremath, CMT

NIFTYNifty levels are based on imbalances
1. gapup 22300 long
2. 22300-22150 trade breakout
3. gapdown 22150 short

Review and plan for 3td March 2025 Nifty future and banknifty future analysis and intraday plan.
This video is for information/education purpose only. you are 100% responsible for any actions you take by reading/viewing this post.
please consult your financial advisor before taking any action.
----Vinaykumar hiremath, CMT
