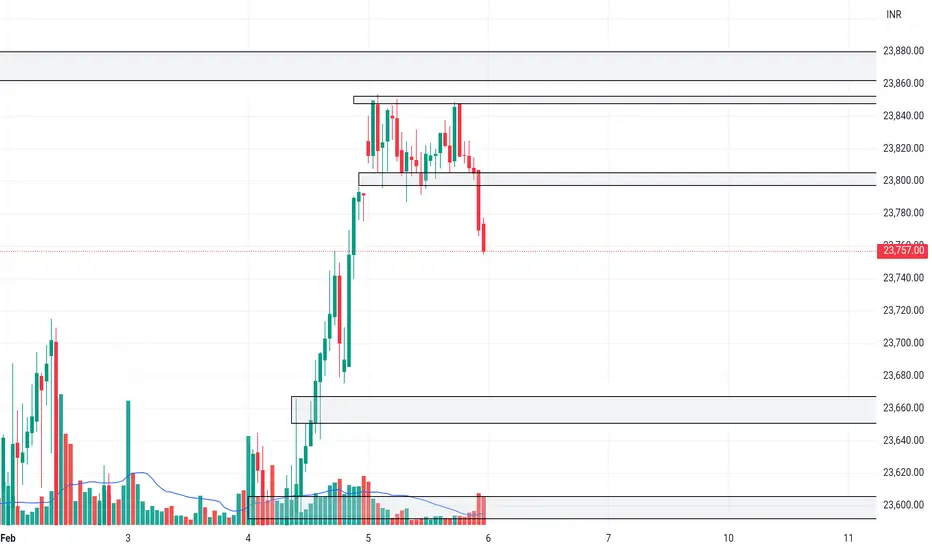
NIFTY Nifty levels are based on imbalances
1. gapup 23800 long
2. 23800-23660 trade breakout
3. gapdown 23660 short
NIFTY1! trade ideas
NIFTYNifty levels are based on imbalances
1. gapup 23880 long
2. 23880-23680 trade reversal
3. gapdown 23680 short

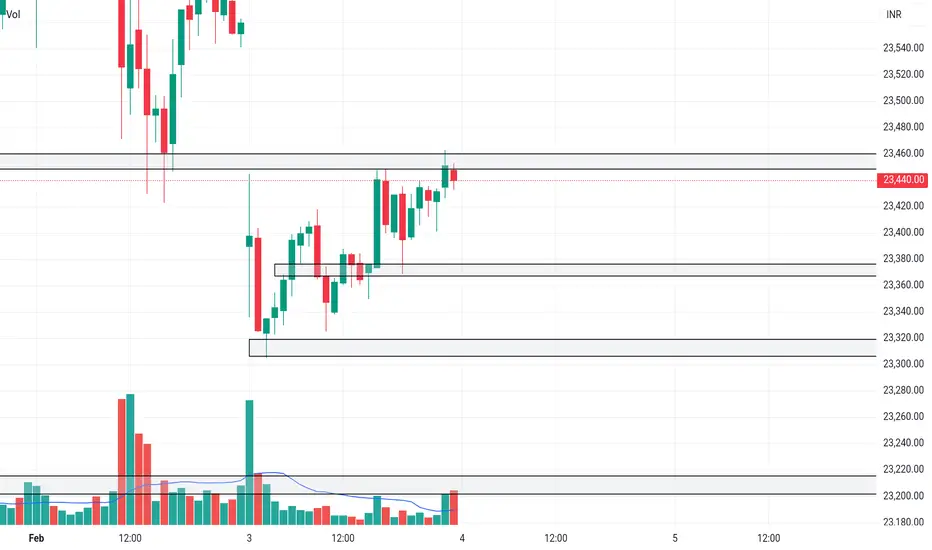
NIFTYNifty levels are based on imbalances
1. gapup 23460 long
2. 23460-23360 trade breakout
3. gapdown 23360 short
NIfty future multi-timeframe analysisHi,
we are seeing the negative movement of the index, since, the start of october' 2024, nifty future got resistance from a 12M trend line earlier, now got the support from a 12M tl, under resistance from another trendline
index formed a H&S and got good support from the neck line but under the resistance from the 2024 mid level, index is above the 2025 opening level , but below the falling trendline, so resistance is there
previous month bank nifty monthly mid bollinger also helped the nifty, acted as a strong support
there is a -ve MACD split/crossover in the monthly tf, also for the nifty and the banknifty ,index is below the weekly 50 MA
you are going to find the patterns followed by the index in different time frames in the below graphics , with lot of information
hope you will like it
thanks

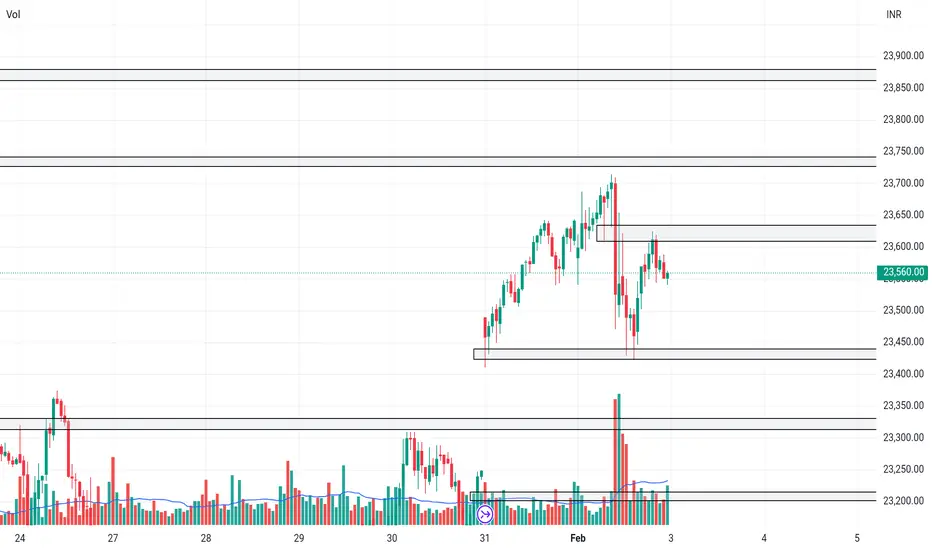
NIFTYNifty levels are based on imbalances
1. gapup 23650 long
2. 23650-23450 trade breakout
3. gapdown 23450 long
Review and plan fo 1st February 2025 Nifty future and banknifty future analysis and intraday plan in kannada.
Positional trading ideas included.
This video is for information/education purpose only. you are 100% responsible for any actions you take by reading/viewing this post.
please consult your financial advisor before taking any action.
----Vinaykumar hiremath, CMT

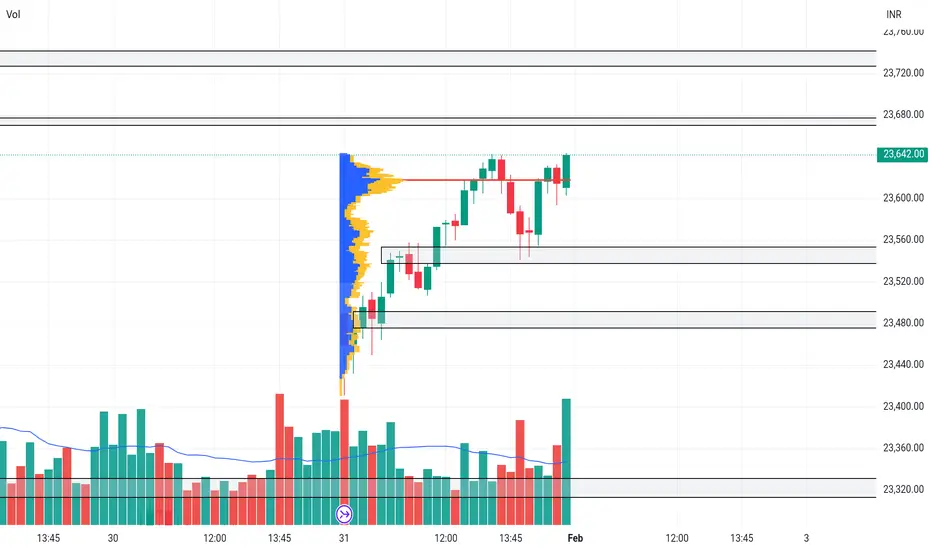
NIFTYNifty levels are based on imbalances
1. gapup 23680 long
2. 23680-23550 trade breakout
3. gapdown 23550 short
NIFTYNifty levels are based on imbalances
1. gapup 23320 long
2. 23320-23100 trade breakout
3. gapdown 23100 short

NIFTYNifty levels are based on imbalances
1. gapupb 23250 long
2.b 23250-23000 trade reversal
3. gapdown 23000 short

NIFTYNifty levels are based on imbalances
1. gapup 23050 long
2. 23050-22950 trade breakout
3. gapdown 22920 short

Nifty to test 23550 ?NSE:NIFTY is Nifty ready to test 23,550 ?
It seems nifty to hold 22,500 in Feb and to test 23,500 on your side


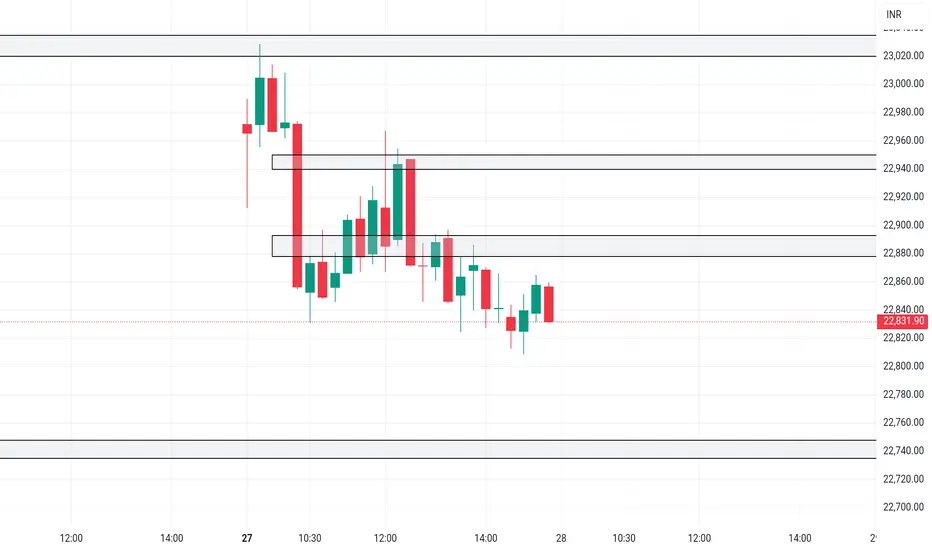
NIFTYNifty levels are based on imbalances
1. gapup 22900 long
2. 22900-22750 trade breakout
3. gapdown 22750 short
NIFTYNifty levels are based on imbalances
1. gapup 23250 long
2. 23250-23000 trade reversal
3. gapdown 23000 short

NIFTYNifty levels are based on imbalances
1. gapup 23320 long
2. 23320-23240 trade breakout
3. gapdown 23240 short

NIFTYNifty levels are based on imbalances
1. gapup 23240 long
2. 23240-23080 trade breakout
3. gapdown 23000 short

NIFTYNifty levels are based on imbalances
1. gapup 23250 long
2. 23250-23000 trade breakout
3. gapdown 23000 short

NIFTYNifty levels are based on imbalances
1. gapup 23450 ,long
2. 23450--23300 trade breakout
3. gapdown 23300 short

Simple study makes life easy.. Hi friends,
Below is the simple study which will make life easy.. get out of the noise and think in your own way.. you will achieve your goals when everyone is struggling..
* This content is only for educational purpose don't trade or take any risk in this..

NIFTYNifty levels are based on imbalances
1. gapup 23350 long
2. 23350-23200 trade breakout
3. gapdown 23200 short

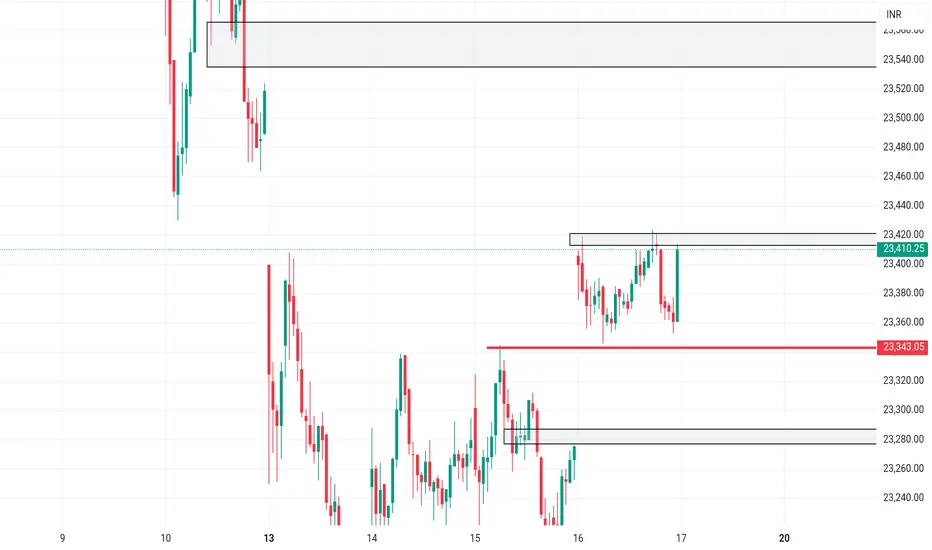
NIFTYNifty levels are based on imbalances
1. gapup 23420 long
2. 23420-23340 trade breakout
3. gapdown 23340 short
NIFTYNifty levels are based on imbalances
1. gapup 23290 long
2. 23290-23190 trade breakout
3. gapdown 23190 short

NIFTYNifty levels are based on imbalances
1. gapup 23340 long
2. 23340-23240 trade breakout
3. gapdown 23240 short
