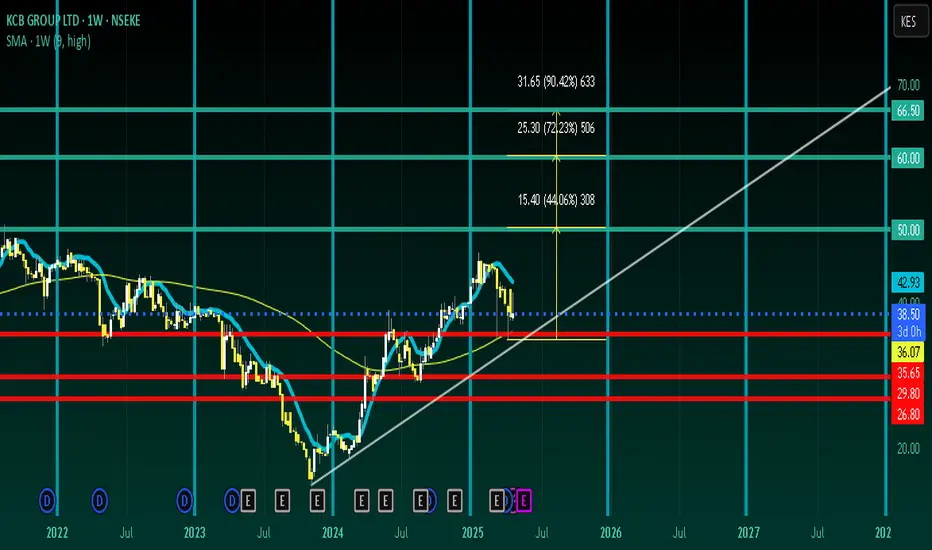
KCB LONGS : OUTSIDE NEW YORK SERIES EP2Inside nairobi
we looking for alternatives as trumpville puts the hurts n the fed aint coming to save
so he claims so we tryna see if its gonna be a global domino or if there will be an unexpected reaction pushing emerging economies
banking always know where the money be so im betting on them bett
Next report date
—
Report period
—
EPS estimate
—
Revenue estimate
—
18.70 KES
60.09 B KES
284.74 B KES
2.52 B
About KCB GROUP LTD
Sector
Industry
CEO
Paul R. Russo
Website
Headquarters
Nairobi
Founded
1896
ISIN
KE0000000315
FIGI
BBG000HD9FT8
KCB Group Plc engages in the provision of financial solutions. It operates through the following segments: Retail Banking, Corporate Banking, Mortgages, Treasury, and Other. The Retail Banking segment provides services such as customer current accounts, savings and fixed deposits to individuals. The Corporate Banking segment offers services such as current accounts, fixed deposits, overdrafts, loans and other credit facilities both in local and foreign currencies. The Mortgages segment engages in the provision of mortgage finance. The Treasury segment operates the company's funds management activities. The Other segment comprises trade finance and forex business activities. KCB Group was founded in 1896 and is headquartered in Nairobi, Kenya.
Related stocks
ELLIOTT WAVE(BANKS)In the image, a clear 5 Wave move can be seen, obeying both the Elliott Wave Principle and Fibonacci Sequence. Elliott Wave represents the Psychological aspect of the market as it is itself A Law of Nature while Fibonacci Sequence is the Mathematical Aspect. Since the Market deals in numbers, we nee

trendline acting as potential supportKCB has experienced a series of higher lows. price is just about interacting with the trendline for the third time. we anticipate a bounce off that trendline.
a firm candlestick closure below the trendline would invalidate the setup.

KCB bounceInvestors have seen significant paper loss holding KCB shares. The problem is that most Kenyan investors are herd investors. And the herd always gets slaughtered. In an analysis presented to a local investor early this year, this is part of the analysis presented and we had our first buy orders fill

A simple way of looking at stocksHello,
A simple way of looking at companies is by looking at their charts. The chart tells you a story the balance sheet might never communicate. It gives a story of who between the sellers & buyers is in control. First, let us understand what the candlesticks are and how they can be used
Candles

KCB SHORTKCB has had a very impressive run over the years. But fundamentals state that demand must meet supply at equilibrium. After its long rally, price is finally starting to ‘balance out’ in the chart as we saw price break out of the triangular wedge and did a huge sell off to the downside as it tries to

How to begin investing in KenyaHello,
Owning shares in the Kenyan stock market can be an exciting and potentially lucrative investment opportunity. The following steps outline the process of owning shares in the Kenyan stock market:
Open a CDS Account:
The first step is to open a Central Depository System (CDS) account. If yo

See all ideas
Summarizing what the indicators are suggesting.
Neutral
SellBuy
Strong sellStrong buy
Strong sellSellNeutralBuyStrong buy
Neutral
SellBuy
Strong sellStrong buy
Strong sellSellNeutralBuyStrong buy
Neutral
SellBuy
Strong sellStrong buy
Strong sellSellNeutralBuyStrong buy
An aggregate view of professional's ratings.
Neutral
SellBuy
Strong sellStrong buy
Strong sellSellNeutralBuyStrong buy
Neutral
SellBuy
Strong sellStrong buy
Strong sellSellNeutralBuyStrong buy
Neutral
SellBuy
Strong sellStrong buy
Strong sellSellNeutralBuyStrong buy
Displays a symbol's price movements over previous years to identify recurring trends.
Frequently Asked Questions
The current price of KCB is 47.35 KES — it has decreased by −0.21% in the past 24 hours. Watch KCB GROUP LTD stock price performance more closely on the chart.
Depending on the exchange, the stock ticker may vary. For instance, on NSEKE exchange KCB GROUP LTD stocks are traded under the ticker KCB.
KCB stock has risen by 1.83% compared to the previous week, the month change is a 0.74% rise, over the last year KCB GROUP LTD has showed a 56.27% increase.
We've gathered analysts' opinions on KCB GROUP LTD future price: according to them, KCB price has a max estimate of 53.04 KES and a min estimate of 52.05 KES. Watch KCB chart and read a more detailed KCB GROUP LTD stock forecast: see what analysts think of KCB GROUP LTD and suggest that you do with its stocks.
Today KCB GROUP LTD has the market capitalization of 152.00 B, it has decreased by −1.29% over the last week.
Yes, you can track KCB GROUP LTD financials in yearly and quarterly reports right on TradingView.
KCB GROUP LTD is going to release the next earnings report on Aug 13, 2025. Keep track of upcoming events with our Earnings Calendar.
KCB net income for the last quarter is 16.09 B KES, while the quarter before that showed 15.59 B KES of net income which accounts for 3.23% change. Track more KCB GROUP LTD financial stats to get the full picture.
KCB GROUP LTD dividend yield was 7.21% in 2024, and payout ratio reached 16.04%. The year before the numbers were 0.00% and 0.00% correspondingly. See high-dividend stocks and find more opportunities for your portfolio.
As of Aug 3, 2025, the company has 10.08 K employees. See our rating of the largest employees — is KCB GROUP LTD on this list?
Like other stocks, KCB shares are traded on stock exchanges, e.g. Nasdaq, Nyse, Euronext, and the easiest way to buy them is through an online stock broker. To do this, you need to open an account and follow a broker's procedures, then start trading. You can trade KCB GROUP LTD stock right from TradingView charts — choose your broker and connect to your account.
Investing in stocks requires a comprehensive research: you should carefully study all the available data, e.g. company's financials, related news, and its technical analysis. So KCB GROUP LTD technincal analysis shows the buy rating today, and its 1 week rating is buy. Since market conditions are prone to changes, it's worth looking a bit further into the future — according to the 1 month rating KCB GROUP LTD stock shows the buy signal. See more of KCB GROUP LTD technicals for a more comprehensive analysis.
If you're still not sure, try looking for inspiration in our curated watchlists.
If you're still not sure, try looking for inspiration in our curated watchlists.