CSE ASI BEARISH SETUPThe monthly chart of the CSE All Share Price Index (ASI) reveals a technically significant scenario: the index is currently testing the upper boundary of a long-term ascending channel while also aligning with the 1.618 Fibonacci extension, both of which signal potential reversal pressure ahead.
Key Observations:
Long-Term Resistance: The price is testing the channel’s upper resistance line near the 17,000 – 17,700 zone, where rejection often occurs historically.
Fibonacci Confluence: The current high coincides with the 1.618 Fibonacci extension, a critical level where long rallies often stall or reverse.
Bearish Candlestick Pattern: The formation of a potential bearish reversal candle near the resistance zone is an early signal of seller interest.
Expected Retracement Levels:
Initial support lies at the 0.382 and 0.5 Fibonacci retracement zones, around 15,000 – 14,000.
Deeper correction could target the 0.618 level (~13,000), which aligns with previous breakout structure and the channel midline.
Conclusion:
The ASI appears overextended after a strong bullish leg and is currently showing signs of exhaustion at the top of a multi-year channel. Unless price breaks above and sustains above 17,700, a correction toward the 13,000–14,000 zone is likely, supported by Fibonacci retracement levels and the channel structure.
This presents a potential medium-term bearish outlook for investors and swing traders, with caution advised around current highs.
ASI trade ideas

ASPI CSEDisclaimer;
The information provided on this website does not constitute investment advice, financial advice, trading advice, or any other advice, and you should not treat any of the website’s content as such. We do not recommend buying, selling, or holding any stock. Nothing on this website should be taken as an offer to buy, sell or hold a stock. Conduct your due diligence and consult your financial advisor before making investment decisions.
I do not accept any responsibility and will not be liable for the investment decisions you make based on the information provided on the website.
Anuradha Godellawatte

ASIDisclaimer
The information provided on this website does not constitute investment advice, financial advice, trading advice, or any other advice, and you should not treat any of the website’s content as such. We do not recommend buying, selling, or holding any stock. Nothing on this website should be taken as an offer to buy, sell or hold a stock. Conduct your due diligence and consult your financial advisor before making investment decisions.
I do not accept any responsibility and will not be liable for the investment decisions you make based on the information provided on the website.

ASPI CSEDisclaimer;
The information provided on this website does not constitute investment advice, financial advice, trading advice, or any other advice, and you should not treat any of the website’s content as such. We do not recommend buying, selling, or holding any stock. Nothing on this website should be taken as an offer to buy, sell or hold a stock. Conduct your due diligence and consult your financial advisor before making investment decisions.
I do not accept any responsibility and will not be liable for the investment decisions you make based on the information provided on the website.
Weekly ASI Performance AnalysisWeekly Close
Market had a weekly close above level 3, the last horizontal resistance before testing all time high again.
Incidentally market reached the target of the pattern, of which breakout happened on April 24th, 2025.
What Next:
We continue to remain bullish on the ASI/CSE and believe we may record a new all-time high in 2025.
1. CBSL gave an unexpected rate cut in May 2025, indicating low-interest rate regime will continue further well into next year. Inflows into CSE will increase further as yield of fixed income instruments are becoming more & more unattractive.
2. Companies have delivered solid earnings for the just concluded FY 2024/25.
3. Market valuations are still low compared to previous bull markets during 2009-2012 and 2020-2022.
4. Opportunities arising from vehicle importations are yet to materialize for the respective sectors.
5. Probability of IMF releasing the next tranche is very high during next few weeks.
6. Government is strongly committed to the IMF program.
Be watchful
1. Developments on US/SL trade talks
2. IMF actions and commentary

Update! 1st Quarter Nigerian Share Picks for 2025 (DEC30-MAR31)We analyzed the price movement of 17 publicly listed company shares, comparing their old prices by Dec30th with new prices by end of quarter. This comparison reveals how each stock performed over the given period and helps assess the general market sentiment across this portfolio.
Statistical Summary
Total companies analyzed: 17
Number of gainers (price increased): 10
Number of losers (price decreased): 7
Average percentage change: ➕ 13.76%
This average suggests a bullish trend within the portfolio, despite a few significant under-performers.
🟢 Top Gainers
SCOA +117.48% Massive rally – more than doubled in price. Could be due to investor speculation or positive corporate news.
UPDC +69.62% Strong recovery or rebound stock. Possibly tied to sector trends or earnings.
NASCON +34.84% Solid upward move, indicating strong market confidence.
MULTIVERSI +29.10% Significant growth, possibly attracting retail investors.
MTNN +17.88% Strong performance for a blue-chip telecom stock.
GUINNESS +13.87% Good recovery in consumer goods.
STANBIC +7.64% Moderate and steady gain.
THOMASWY +7.56% Slight bounce, could be early recovery.
DANGCEM +0.25% Flat movement, possibly in consolidation.
NB +0.47% Barely moved, suggesting price stability.
🔴 Top Losers
OMATEK -13.43% Notable drop – could signal weak fundamentals or low investor interest.
FTNCOCOA -11.67% Decline may reflect volatility in agricultural commodities.
BUACEMENT -10.00% Unexpected drop for an industrial giant; may relate to earnings or sector news.
FBNH -10.46% A surprising dip for a major bank; profit-taking or macro concerns.
DAARCOMM -4.76% Mild loss, potentially sector-related.
DANGSUGAR -6.60% Slight underperformance in the consumer space.
CHAMS -7.50% Small cap volatility – typical in tech or service stocks.
KEY TAKEAWAY
Overall trend: The average gain of 13.76% indicates that investor sentiment was generally positive across portfolio.
- Volatility: Stocks like SCOA and UPDC experienced massive swings, showing high volatility and possibly speculative trading activity.
- Sector winners: Consumer goods (e.g., NASCON, GUINNESS), real estate (UPDC), and telecom (MTNN) showed strength.
- Sector losers: Some financial (FBNH) and industrial (BUACEMENT) stocks underperformed, hinting at potential profit-taking or sectoral headwinds.
RECOMMENDATION:
Monitor Consistency: Stocks with mild or flat movements (like NB and DANGCEM) may indicate stability or a base for future rallies.
Diversify Holdings: Given the volatility, ensure sector diversification to mitigate risk.

ASI - CSELKDisclaimer
The information provided on this website does not constitute investment advice, financial advice, trading advice, or any other advice, and you should not treat any of the website’s content as such. We do not recommend buying, selling, or holding any stock. Nothing on this website should be taken as an offer to buy, sell or hold a stock. Conduct your due diligence and consult your financial advisor before making investment decisions.
I do not accept any responsibility and will not be liable for the investment decisions you make based on the information provided on the website.

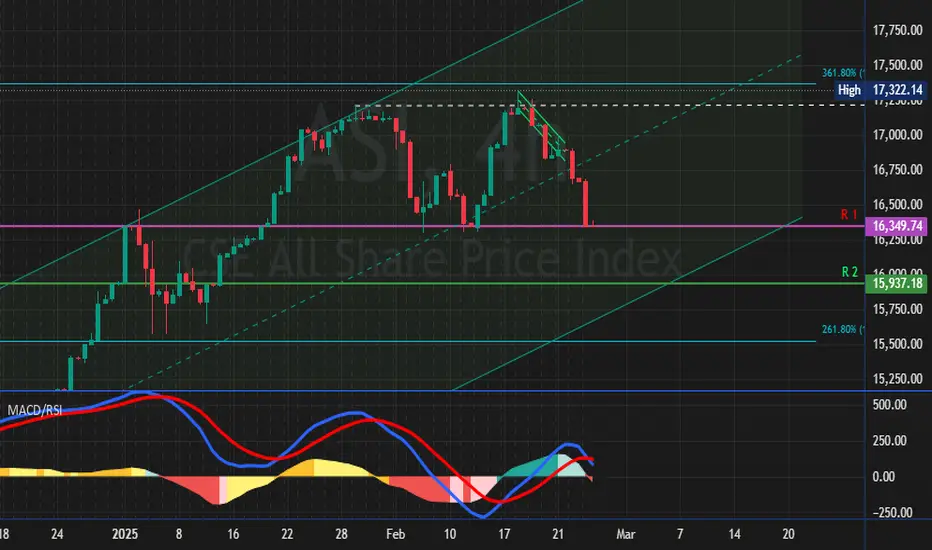
ASI Update - 17/02/2025🔹 The ASI Index remains in a strong uptrend, with bullish momentum pushing prices towards major resistance zones.
Key Levels to Watch:
✅ Resistance:
17,837 → 1.618 Fibonacci Extension and a critical resistance level.
17,093 - 17,092 → Short-term resistance before Fib extension.
🔻 Support:
16,728 → Key support if ASI pulls back.
16,242 - 15,523 → Major demand zones.
📈 Bullish Scenario:
If 17,837 is broken with volume, ASI could continue its rally towards new highs.
📉 Bearish Scenario:
Failure to break resistance may lead to a pullback towards 16,728 or lower support levels.
📝 Conclusion:
ASI remains bullish, but traders should watch for reactions at resistance levels.
A breakout above 17,837 would confirm further upside, while a pullback would provide potential re-entry zones.
💬 Let me know your thoughts in the comments! 👇
#CSE #ASI #SriLankaStocks #StockMarket #TradingView

All Share Index (ASI) Movement after weekly MACD crossingColombo Stock Exchange (CSE) All Share Index (ASI) Movement after weekly MACD crossing
Based on last 5 cycles
Avg. Upside since weekly MACD crossing = 41.12%
Avg. duration of upward move since weekly MACD crossing = 109.6 Days

ASI - Bull cycle for stock market in Sri lankaLong term targets for ASI indicated in above chart.
Disclaimer: The information and analysis provided in this publication are for educational purposes only and should not be construed as financial advice or recommendations to buy, sell, or hold any securities. The author and TradingView are not responsible for any investment decisions made based on the content presented herein. Always consult a financial professional before making any investment decisions.

ASI - All time high in 2025 Q1?1. Observations on Fibonacci Levels
Current Resistance at 0.786 Fib Level (~12,123):
The index has successfully moved past several key Fibonacci retracement levels and is now approaching the 0.786 level.
A confirmed breakout above this level, with a daily/weekly candle close, would further strengthen the bullish momentum.
Golden Pocket (~10,969 - 11,189):
The golden pocket zone (0.618) previously acted as strong resistance, but it has now turned into a support zone, affirming the current uptrend.
Target: 1.618 Extension (~17,837):
The 1.618 Fibonacci extension level at 17,837 is a likely target if the index maintains its bullish momentum throughout 2025.
This projection aligns with a potential all-time high under strong market conditions.
2. Channel Observation
The ASI is trading within a clear upward parallel channel, with higher highs and higher lows forming a solid bullish structure.
The upper bound of this channel aligns with the 1.618 Fibonacci extension level, further strengthening the case for 17,837 as a medium- to long-term target.
3. Indicators
RSI:
The RSI is nearing overbought levels, suggesting that the index might face short-term resistance or a pullback before continuing its upward trajectory.
MACD:
The MACD is showing bullish momentum, with a positive crossover and rising histogram bars. This supports the upward trend.
4. Key Levels to Watch
Support Levels:
12,123 (0.786 Fib): Needs to hold as support if the index retraces.
10,969 - 11,189 (Golden Pocket): Acts as the next strong support zone.
10,158 (0.5 Fib): A deeper retracement level, likely to hold during a major pullback.
Resistance Levels:
Immediate resistance is at 13,593 (1.0 Fib).
The next major resistance is the 1.272 extension (~15,257) before targeting 1.618 (~17,837).
5. Risks and Considerations
The overbought RSI could lead to short-term corrections.
Macro-economic factors, such as local and global economic conditions, could impact the bullish scenario.
Disclaimer: The information and analysis provided in this publication are for educational purposes only and should not be construed as financial advice or recommendations to buy, sell, or hold any securities. The author and TradingView are not responsible for any investment decisions made based on the content presented herein. Always consult a financial professional before making any investment decisions.

ASI Weekly Chart Update - 29/04/2024Resistance Zone - 13300 to 13600
Support Zone - 11000 to 11275
Disclaimer: The information and analysis provided in this publication are for educational purposes only and should not be construed as financial advice or recommendations to buy, sell, or hold any securities. The author and TradingView are not responsible for any investment decisions made based on the content presented herein. Always consult a financial professional before making any investment decisions.

ASI Daily ChartThis chart and analysis are not financial advice. Do your own research before trading or investing.
Bullish Signs:
01. Strong Uptrend: The market recently bounced from a significant low of around 10,250-10,450, marked as a major support (S1) zone. Prices have surged past 11,000, and the current price sits above 11,773.
02. Moving Averages Support: The price has climbed above the moving averages, often a sign of strength. We can see the shorter-term moving averages (yellow and purple) crossing the longer-term ones (blue). This "golden cross" suggests potential continued upward momentum.
03. Fibonacci Levels: The price is now testing a key resistance level between 11,620 and 11,750. A break above this zone could lead to further bullish momentum, potentially targeting the next resistance zone around 12,000-12,100.
04. RSI Indicator: The Relative Strength Index (RSI) is 74.19, indicating that the market is overbought but bullish. It shows strong momentum but also signals caution.
05. Pullback Zone: The chart suggests a potential pullback zone, where prices might correct before continuing higher. This is healthy for the market as it helps cool off overbought conditions.
Risks & Considerations:
01. Resistance Ahead: The 11,620-11,750 level and the 12,000-12,100 zones are critical resistance points. If the price fails to break these levels, it could reverse and move back towards lower support levels.
02. Overbought RSI: While momentum is strong, the RSI nearing overbought territory means there could be a short-term correction or consolidation. It's important to watch for any signs of weakness.
03. Pullback Possibility: If prices pull back, key support levels to watch are around 11,340-11,470 and 11,080-11,100. A fall below these could signal a deeper retracement, potentially back to 10,800-10,700 or even the 10,250-10,450 support.

Since May 2024, a downward wave has been recovered over 70% Since May 2024, a downward wave has been recovered over 70% within less than a week and a half with aggressive bullish momentum on CSE index, Since May 2024, a downward wave has recovered over 70% within less than a week and a half with aggressive bullish momentum on the CSE index.
Political correction efforts have been established with the presidential election in Colombo assuring the trust of CSE investors.
by Udaya Nothern emir 26th Sep 2024

ASI - Elliot Wave PatternThe completion of this pattern typically suggests that the market might enter a corrective phase or a new trend might begin. It’s crucial to keep an eye on the key support and resistance levels and be cautious about the potential market movements.
Disclaimer: The information and analysis provided in this publication are for educational purposes only and should not be construed as financial advice or recommendations to buy, sell, or hold any securities. The author and TradingView are not responsible for any investment decisions made based on the content presented herein. Always consult a financial professional before making any investment decisions.

All Share Price Index - Day Chart This chart and analysis are not financial advice. Do your own research before trading or investing.
ASI Daily
01. ASI is taking support at 200 DMA.
02. The bullish divergence shows activation but needs confirmation, which can happen when the latest Lower High is broken.
03. There are signs of lesser selling coming into the market and no more bargain hunting available. To get confirmation of this we need to keep and eye on the daily TO and volumes and number of trades.

ASI DailyThis chart and analysis are not financial advice. Do your own research before trading or investing.
1. The range of the HnS in lying in level of 11522, which is about 200 points above the next support level.
2. The current support which is 11650-11750 may make a confluence zone with the descending widening wedge support line.
3. RSI is reaching the oversold zone and the MACD is showing reversal. But by changing the MACD oscillator to SMA, instead of EMA the picture will be a bit different.
4. The question remains, will the current support hold or will the index move further to the extreme level of 11300 as some techies predict?
Patterns within patterns
HnS - Bearish
Descending broadening wedge - Bullish
Descending wedge - Bullish
Now we need to monitor what will happen in the future.

All Share Price IndexThis chart and analysis are not financial advice. Do your own research before trading or investing.
The ASI bulls have dug in their heels at the crucial 11650-11750 support zone, finding their footing after 18 days of decline. Three days of consolidation paint a picture of accumulation, potentially forming a base for a launch towards 12,000. With no bearish divergences on the horizon, a momentum shift could be brewing. While trading remains muted, this could be a prime buying opportunity for value-seeking investors.

ASI DailyThis chart and analysis are not financial advice. Do your own research before trading or investing.
The ASI is printing lows each day. The support 12000 was demolished and now heading towards the 11650-11750 range while RSI is printing in the oversold area but without any divergences in the daily chart. Also, looking close enough it is visible that the descending broadening wedge, which is a bullish signal, has the support line in the 11650-11750 zone. These levels won't be supported unless there is potential buyers who come in and move the prices. Watching out for potential macro and micro information regarding the ASI is important.

All Share Price IndexThis chart and analysis are not financial advice. Do your research before trading or investing.
"The ASI index took a surprising dive today, dropping a steep 110 points despite positive news about the ISB restructuring. This unexpected decline comes with a twist: foreign investors were highly active, with their purchases making up half of the day's total trading. While technical indicators suggest the market might be oversold and ripe for a rebound, the reasons behind the drop remain unclear. With the ASI potentially nearing a support zone between 11,650 and 11,750 points, investors should stay informed and conduct their own research to understand the market forces at play before making any investment decisions."

CSEASI Weekly TABased on the P&F chart, we can expect a volatility of 200-300 points up or down. Support 12000 and Upside resistance 12500


ASIASI Daily
This chart and analysis are not financial advice. Do your own research before trading or investing.
