NTRNUSDT 1D#NTRN has broken above the neckline of the inverse head & shoulders pattern on the daily chart. The retest has been successfully completed. Targets are:
🎯 $0.1924
🎯 $0.2141
🎯 $0.2449
🎯 $0.2843
⚠️ Use a tight stop-loss.
NTRNUSDT trade ideas

NTRNUSDT – Watch Out! Red Boxes Are Strong Resistance ZonesThe red boxes on NTRUSDT mark powerful resistance areas where significant selling pressure is likely to emerge. These levels are not to be taken lightly, as they have historically been strong barriers for price movement.
🔴 Key Takeaways:
Strong Resistance: The red boxes act as tough resistance zones where sellers are likely to step in.
Exercise Caution: Before making any decisions, ensure you wait for lower timeframe (LTF) breakouts and confirmation using CDV and volume analysis.
Don't Rush: Be patient and allow the market to show you the proper direction. Only engage when the signals are crystal clear.
💡 Plan Your Trade:
Watch the market carefully, be disciplined, and only enter when confirmations align. If you don’t get the right setup, don’t force the trade—let the market come to you.
📌I keep my charts clean and simple because I believe clarity leads to better decisions.
📌My approach is built on years of experience and a solid track record. I don’t claim to know it all but I’m confident in my ability to spot high-probability setups.
📌If you would like to learn how to use the heatmap, cumulative volume delta and volume footprint techniques that I use below to determine very accurate demand regions, you can send me a private message. I help anyone who wants it completely free of charge.
🔑I have a long list of my proven technique below, (I created this list in a couple of months here, most of the traders doesn't have these much runners in their lifes) :
🎯 ZENUSDT.P: Patience & Profitability | %230 Reaction from the Sniper Entry
🐶 DOGEUSDT.P: Next Move
🎨 RENDERUSDT.P: Opportunity of the Month
💎 ETHUSDT.P: Where to Retrace
🟢 BNBUSDT.P: Potential Surge
📊 BTC Dominance: Reaction Zone
🌊 WAVESUSDT.P: Demand Zone Potential
🟣 UNIUSDT.P: Long-Term Trade
🔵 XRPUSDT.P: Entry Zones
🔗 LINKUSDT.P: Follow The River
📈 BTCUSDT.P: Two Key Demand Zones
🟩 POLUSDT: Bullish Momentum
🌟 PENDLEUSDT.P: Where Opportunity Meets Precision
🔥 BTCUSDT.P: Liquidation of Highly Leveraged Longs
🌊 SOLUSDT.P: SOL's Dip - Your Opportunity
🐸 1000PEPEUSDT.P: Prime Bounce Zone Unlocked
🚀 ETHUSDT.P: Set to Explode - Don't Miss This Game Changer
🤖 IQUSDT: Smart Plan
⚡️ PONDUSDT: A Trade Not Taken Is Better Than a Losing One
💼 STMXUSDT: 2 Buying Areas
🐢 TURBOUSDT: Buy Zones and Buyer Presence
🌍 ICPUSDT.P: Massive Upside Potential | Check the Trade Update For Seeing Results
🟠 IDEXUSDT: Spot Buy Area | %26 Profit if You Trade with MSB
📌 USUALUSDT: Buyers Are Active + %70 Profit in Total
🌟 FORTHUSDT: Sniper Entry +%26 Reaction
🐳 QKCUSDT: Sniper Entry +%57 Reaction
📊 BTC.D: Retest of Key Area Highly Likely
📊 XNOUSDT %80 Reaction with a Simple Blue Box!
📊 BELUSDT Amazing %120 Reaction!
I stopped adding to the list because it's kinda tiring to add 5-10 charts in every move but you can check my profile and see that it goes on..

NTRNUSDT 3DNTRN ~ 3D
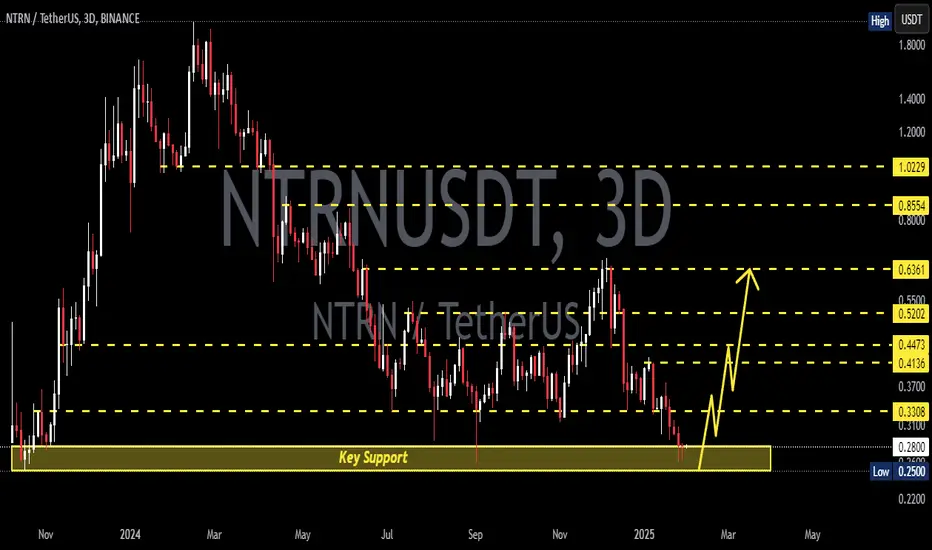
#NTRN This is the last support for this coin. If you still have a Conviction on this coin,. Buy from here with a minimum target of 20%+
NTRNUSDT 3DNTRN ~ 3D
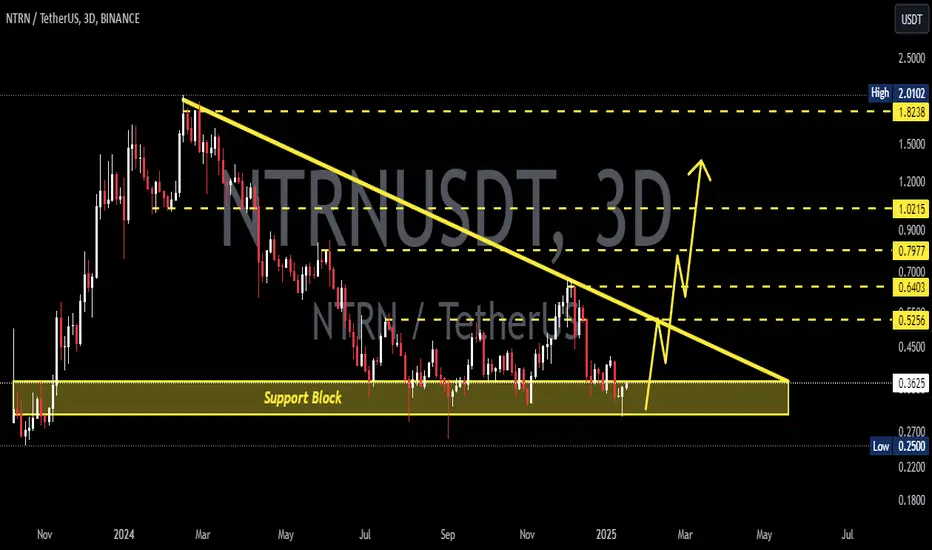
#NTRN Continue to maintain this support ,. If you still have Conviction on this coin,. Buy in stages from here, with a minimum target of 20%++
NTRN/USDT Potential 200%++Accumulate under $0.6 - $0.3
Targets Points
TP 1 : $0.82
TP 2 : $1.19
TP 3 : $1.31
TP 4 : $1.47
TP 5 : $1.63

NTRNUSDTThis opportunity could bring significant gains for those who have been waiting for the right moment. Always enter with precise analysis and proper risk management.
FIRST TP:0.4444
LETS GO

The ATOM Ecosystem is Coming Back to LifeIn the last few days, some tokens have shown significant growth of up to +200%, such as JUNO and Secret, and ATOM itself is also demonstrating solid momentum. Considering these trends, I've decided to focus on the NTRN token and take a trade with a risk/reward of 1/5.
🔝 Entry setup with a risk/reward of 1/5 🔝
📊 My Strategy:
🟢 Buy Zone: $0.44 - $0.45
🎯 Targets (Take Profit):
TP1: $0.54
TP2: $0.68
TP3: $0.93
🛑 Stop-Loss: $0.35
⚠️ Be cautious and don’t forget about risk management! The cryptocurrency market remains highly volatile, so always conduct your own analysis before investing.

NTRNUSDT 3DNTRN ~ 3D
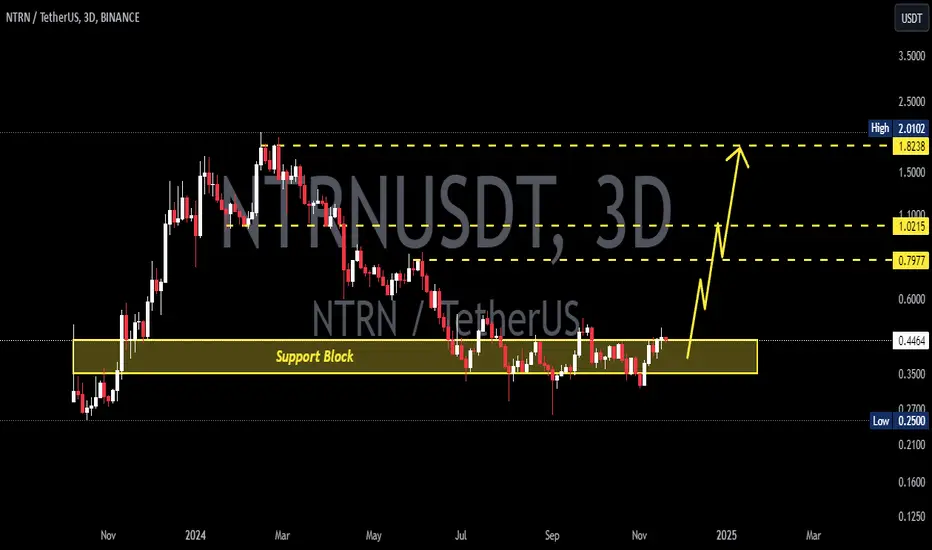
#NTRN Seller pressure is over. And now the price is moving sideways on this support block,. looks like an accumulation area. if you are interested in this coin,. Maybe this support block will be a very good buying place for now,. Minimum target 20%+
#NTRN/USDT#NTRN
The price is moving in a descending channel on the 12-hour frame and it was broken upwards
We have a bounce from a major support area in green at 0.3300
We have a downtrend RSI that was broken upwards which supports the upside
We have a trend to stabilize above the 100 moving average which supports the upside
Entry price 0.3570
First target 0.4445
Second target 0.5056
Third target 0.5762

NTRNUSDTHMT v1.0 spotted. Looking good with previous wave up with increasing volume and momentum.
- BOS (Breaks of Structure) at @ 0.3854-0.3893 level
- Trending slow and steady if able to hold above the BOS level
It is at extremely good reward to risk level.

#NTRN (SPOT) entry range( 0.33- 0.39)T.(0.7630) SL(0.3140)BINANCE:NTRNUSDT
entry range( 0.33- 0.39)
Target (0.7630)
1 Extra Targets(optional) in chart, if you like to continue in the trade with making stoploss very high.
SL .1D close below (0.3140)
*** collect the coin slowly in the entry range ***
*** No FOMO - No Rush , it is a long journey ***
**** #Manta ,#OMNI, #DYM, #AI, #IO, #XAI , #ACE #NFP #RAD #WLD #ORDI #BLUR #SUI #Voxel #AEVO #VITE #APE #RDNT #FLUX #NMR #VANRY #TRB #HBAR #DGB #XEC #ERN #ALT #IO #ACA #HIVE #ASTR #ARDR #PIXEL #LTO #AERGO #SCRT #ATA #HOOK #FLOW #KSM #HFT #MINA #DATA #SC #JOE #RDNT #IQ #CFX #BICO #CTSI #KMD #FXS #DEGO #FORTH # AST #PORTAL #CYBER #CLV #RIF #ENJ #ZIL #APT #GALA #STEEM #ONE #LINK #NTRN ****

NTRN: Will This Bullish Pattern Spark a 261% Surge?The #NTRNUSDT pair is showing a textbook example of a descending wedge, a pattern often associated with strong bullish reversals. Currently, the price sits at $0.3871, near the lower boundary of the wedge, hinting at potential upward momentum.
The breakout target from this pattern points to a massive 261.41% increase, with the price potentially reaching as high as $1.0103. The descending wedge, coupled with a strong support level and increasing volume, makes this a critical setup to watch.
Traders should keep an eye on the price action near the wedge’s upper trendline and look for confirmation of a breakout before entering the trade. If the resistance breaks, it could be the beginning of a significant bullish run.

Reversal Action on the wayThe price movement suggests a potential double bottom or a rounded bottom pattern, indicating a reversal from a downtrend to an uptrend.
- Support Level: The price seems to be finding support around 0.40, which could act as a strong base for a bullish move.
- Resistance Level: The recent high around 0.80 could serve as a target for bullish trades.
- Entry Point: Consider entering a long position around the current price of 0.47.
- Stop-Loss: Set a stop-loss just below the recent support level at around 0.38 to manage risk.
- Target Price: A reasonable target could be around 0.80, providing a good risk-to-reward ratio.
Summary
- Buy: 0.47
- Stop-Loss: 0.38
- Target: 0.80

Reverse action is on the way A potential "Cup and Handle" pattern, which is typically considered a bullish formation. Here’s a breakdown of a trading strategy based on this pattern:
- Entry: 0.4702
- Target: 0.6702
- Stop-Loss: 0.4000

NTRNUSDTGood Luck >>
• Warning •
Any deal I share does not mean that I am forcing you to enter into it, you enter in with your full risk, because I'll not gain any profits with you in the end.
The risk management of the position must comply with the stop loss.
(I am not sharing financial or investment advice, you should do your own research for your money.)

MUST SEE: The Perfect Setup - How to Make 50 %!Hey Future Demons
I'm back again, and we don't have time to waste, so let's jump right into the TA.
I want to spoil you today with the perfect setup. Everything aligns. It is beautiful. Its almost too good to be true. Let me make it very clear though, than nothing is certain when it comes to trading.
I will put a 70 % credence on this setup though (Bayesian Reasoning). This is Neutron (NTRN).
1. We are in a huge descending wedge, which a bullish pattern (Perfect ABCDE)
2. The volume is dropping, which is what usually happens before we see a spike. It is also a sign, that traders slowly have been accumulating the coin.
3. Look at the RSI. We have clear bullish divergence.
4. The same goes for the MACD. Bullish divergence and a MACD-cross, which means that the Bulls finally are ready to take over.
Kind Regards
Laplace's Demon
PS. Remember to LIKE and FOLLOW. I will continue to provide you with quality content, and my mission is to teach you how to outsmart the Elite, the big whales and Wall Street. Market Psychology is my biggest strength.

NTRNUSDTNTRN ~ 3D ✅
#NTRN Successfully broke through this descending pattern.
Bulls will push the price even higher as long as the price stays above this descending pattern.


NTRN analysis (1D)From where we placed the red arrow on the chart, it seems that the correction of NTRN has started.
It appears to be in a triangular or diametric pattern.
The price can go up to the red range.
Price now appears to be completing wave D.
The red area is a supply, where you can look for sell/short scalp positions.
Closing a daily candle above the invalidation level will violate the analysis.
For risk management, please don't forget stop loss and capital management
Comment if you have any questions
Thank You

#NTRN/USDT#NTRN
The price is moving within a bearish channel pattern on the 12-hour frame, which is a strong retracement pattern
We have a bounce from a major support area in the color EUR at 0.3800
We have a tendency to stabilize above the Moving Average 100
We have a downtrend on the RSI indicator that supports the rise and gives greater momentum and the price is based on it
Entry price is 0.4475
The first target is 0.5474
The second target is 0.6230
The third goal is 0.7680

NTRNUSDT(Neutron) Daily tf Range Updated till 30-06-24NTRNUSDT(Neutron) Daily timeframe range. another PA is trying here,
it needs to stay above 0.4017 to be in safer side. close to local resistance at 0.5620. if it can clear it will open a more bigger area. for now all it needs volume.

NTRNUSDTBINANCE:NTRNUSDT is forming a falling wedge on daily timeframe , Up we go if we do breakout.
Traders, if you liked this idea or have your opinion on it, write in the comments, We will be glad.
_ _ _ _ __ _ _ _ _ _ _ _ _ _ _ _ _ _ _ _ _ _ _ _ _ _ _ _ _ _ _ _
✅Thank you, and for more ideas, hit ❤️Like❤️ and 🌟Follow🌟!
⚠️Things can change...
The markets are always changing and even with all these signals, the market changes tend to be strong and fast!!
