CJ1! trade ideas


COCOA FUTURES (CONTINUOUS: CURRENT CONTRACT IN FRONT)-The market is in a critical position. a front of a very important support
of (2412)
-For now there is a big probablity that the market
can return tested (2374)
-But if ever it break the resistance with power
the market will go to (2465)

Buy Cocoa dailyHello, the COCOA made an attempt but was pushed back then the resistance to broken with the force and the volume.
Please LIKE & FOLLOW, thank you!


Long term bullish pattern on COCOAWe can see on the COCOA daily chart a bullish pattern called "Cup and Handle", when this pattern is break up (with a big green candle and a big volume) there is a good long signal with an interesting RR ratio.
I will keep an eye on this chart !


CACAO - Attention une accélération puissance en 2 niveauxAttention Attention, aujourd’hui et le prochain jour, il ne faut pas vendre le Cacao, on dirige certainement vers 2438 USD voir plus.

CC - Warning a power acceleration in 2 levelsAttention an acceleration power in 2 levels, Attention today and next day, do not sell the Cocoa, it is certainly heading to 2438 USD see more.

BUY COCOA FUTURES (CONTINUOUS: CURRENT CONTRACT IN FRONT) BUY COCOA FUTURES take profit 2403 and stop lose 2201


Buy the cocoa or keeple cacao presente un véritable potentiel haussier donc nous le conseillons vivement a l'achat

COCOA FUTURESEnter on the retest of the trendline on bearish price action.Chart illustrates this well.

Cocoa will go upCocoa will go up.
**Disclaimer** the content on this analysis is subject to change at any time without notice, and is provided for the sole purpose of assisting traders to make independent investment decisions.

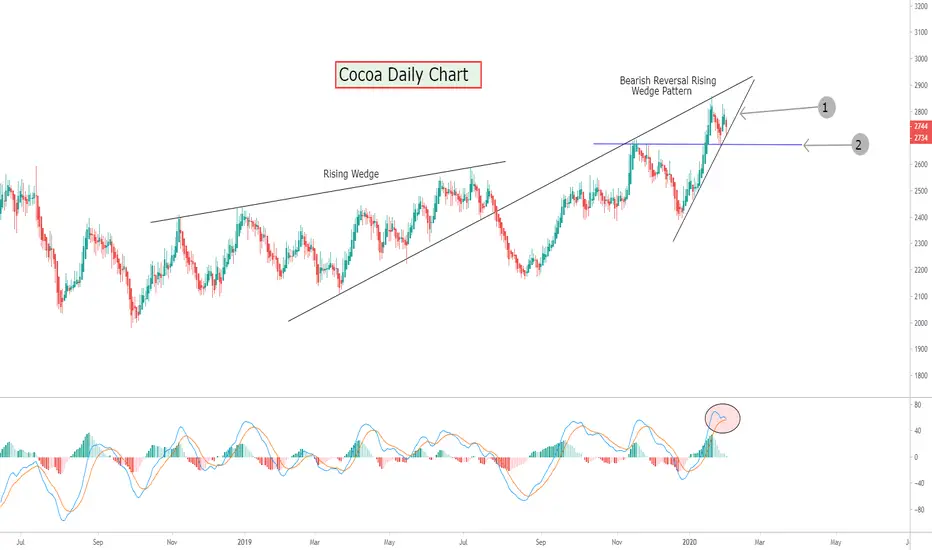
Cocoa Daily Chart. Cocoa testing rising wedge support (1). Further upside is possible for the short to medium term. However, it’s worth noting that ‘Smart Money Hedgers’ have established a multi-year short position on ‘Cocoa’ according to last week's COT report. And so a turn in direction could well be on the cards! A break below wedge support at (1) could be the first clue, a break below horizontal support at (2) would be where you could try a ‘short’ with a first target at 2588/93.
COCOA FUTURES (CC1!) WeeklyDates in the future with the highest probability for price direction reversals

Cocoa: Double top eyed.
‘Smart money’ hedgers have proven themselves over time to have an excellent handle on assets once they have reached an extreme. For Cocoa, they are holding extreme ‘short’ positions last seen at the end of September 2014. From the first week of October 2014 through to January 2015 Cocoa depreciated by 30%.
However, trying to ‘Time the markets’ using sentiment data on Smart Money Hedgers alone is tricky! They can hold extreme Long or Short positions for weeks before the asset in question reaches a turning point.
From a technical standpoint, some would argue that a turning point is on the horizon, we are inside a bearish reversal rising wedge pattern, and up against resistance and a double top pattern is in play.
However on the flip side of the bearish outlook, we need to keep in mind Cocoa broke out of its ascending channel during January this year and is now in a steep uptrend, not forgetting most chart patterns and indicators have approximately a 40% failure rate.
For me, I’m more biased towards the bearish outcome, providing resistance holds and we convincingly break below rising wedge support. Only then I will look to enter a short position with the first target at rising trendline support (top side of ascending channel).


Cocoa Futures at ResistanceCocoa Futures showing some signs of rejection at relevant area of Resistance. Also note that climatic volume which makes me think that there may be selling pressure. 3D chart.
