Crude oil------sell near 68.80, target 66.00-62.00Crude oil market analysis:
Recent crude oil is actually very easy to operate. Sell when it rebounds to a high position. Don't worry about the position. In addition, the daily K-line has also begun to decline, and it is difficult to form a large rebound. The new daily moving average begins to sort.
Contract highlights
Related commodities

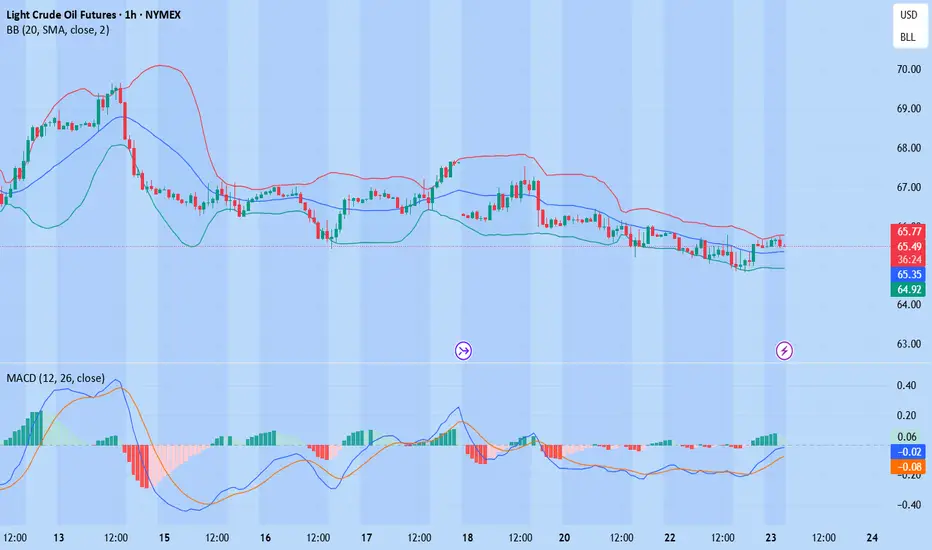
WTI(20250723)Today's AnalysisMarket news:
White House officials plan to visit the Federal Reserve headquarters on Thursday local time.
Technical analysis:
Today's buying and selling boundaries:
65.22
Support and resistance levels:
66.22
65.85
65.61
64.84
64.60
64.22
Trading strategy:
If the price breaks through 65.61, co
Crude oil---sell near 67.50, target 65.00-60.00Crude oil market analysis:
Crude oil has also started to fluctuate recently. Pay attention to the impact of contract delivery on the trend of crude oil. The daily line of crude oil does not show the strength of its rebound. In terms of operation, it is still a rebound sell. Crude oil continues to b

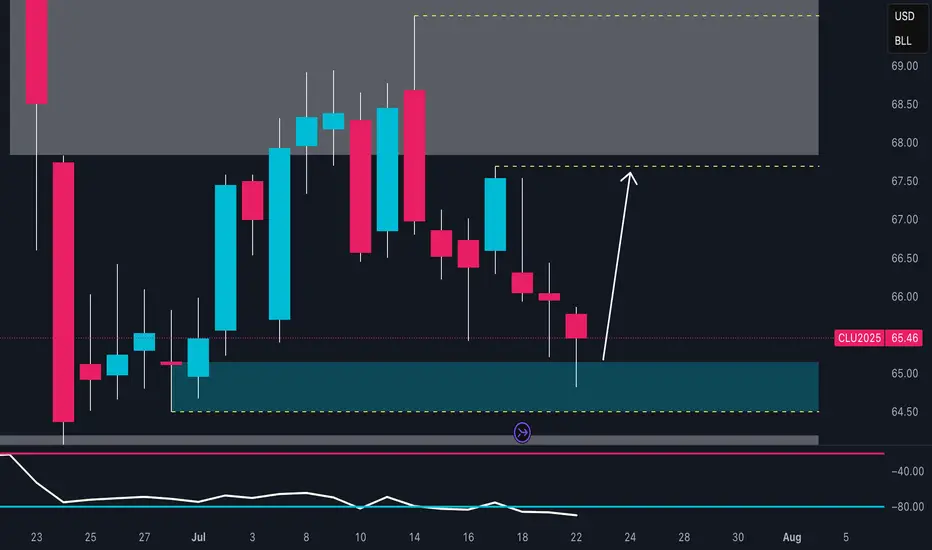
Crude Oil Rebound Incoming? Key Demand Zone 📈 1. Technical Analysis – Daily Chart (CL1!)
The price has returned to a demand zone between 64.60 and 65.30, an area that previously triggered strong bullish reactions.
The July 22nd candle shows a clear lower wick, indicating potential buyer absorption and a possible short-term reversal.
The next
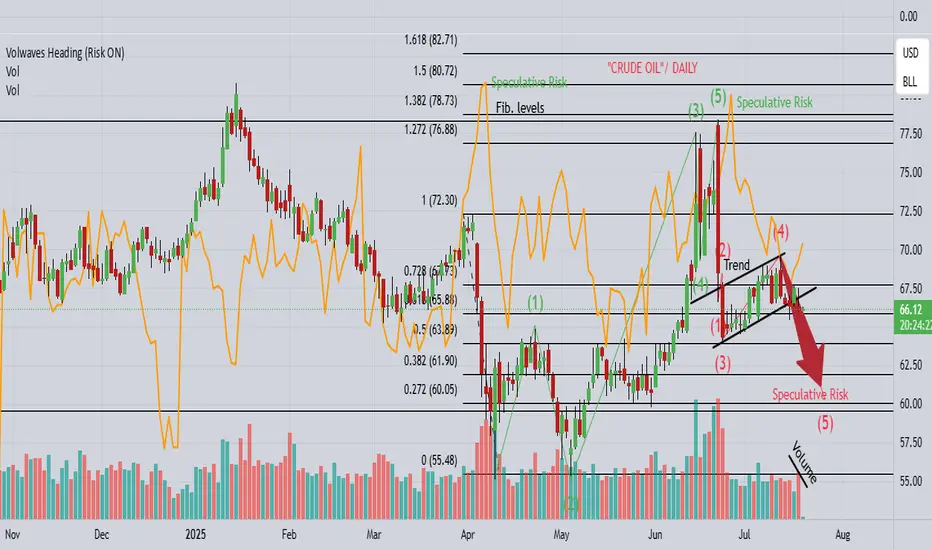
CL "OIL" continues the drop towards $60!1). Wave 5 drop needs a completion lower! 2). Risk is selling off! 3). Volume is falling! 4). Price appears to be heading towards lower market sentiment! 5). Trump is imposing more Tariffs, which is likely causing deeper corrections!
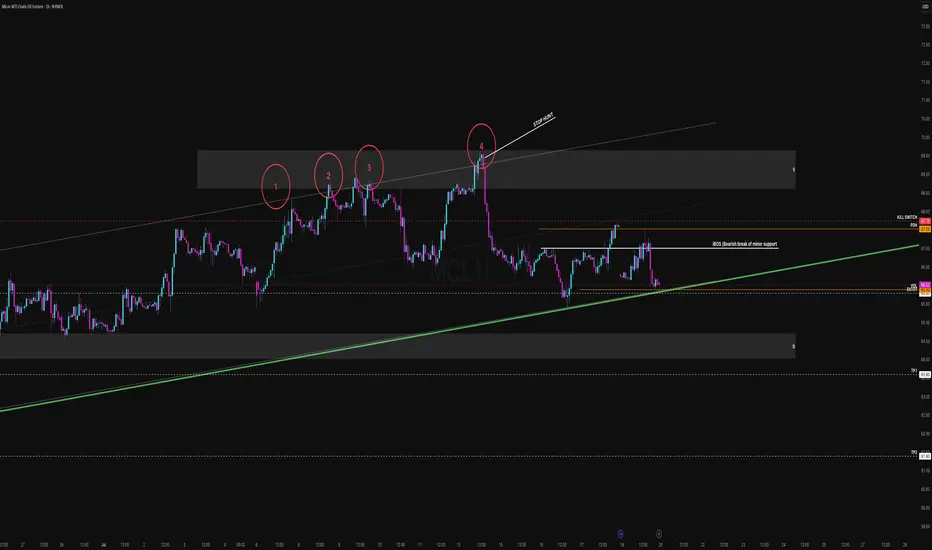
4-Tap Rejection. Compression. Breakdown Incoming?This is a mechanical short setup mapped out ahead of the Sunday futures open. It’s based on clean structure, distribution signals, and a confirmed internal shift in trend via iBOS but it’s not a blind breakdown short. The setup respects demand proximity, prior lows, and the risk of early-week traps
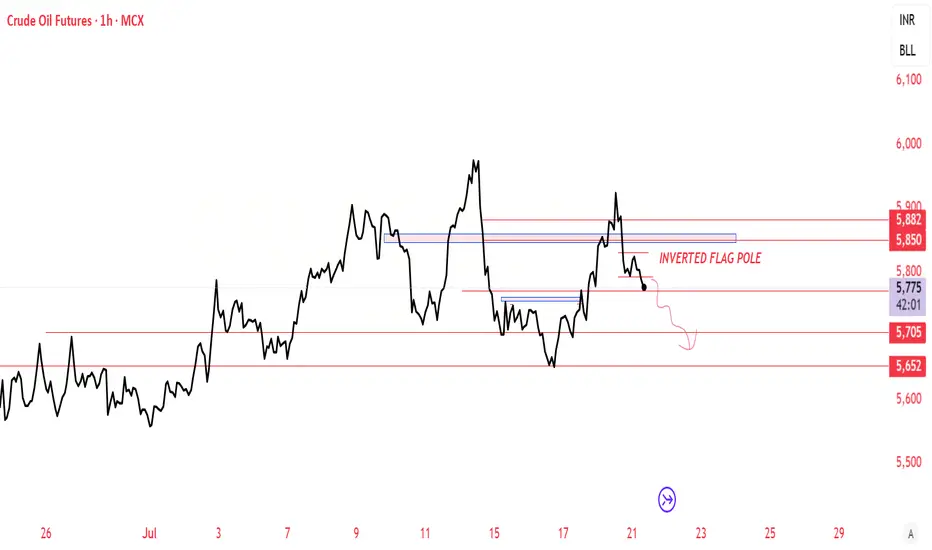
CRUDEOIL - Bearish viewLooking at current scenario of Tarif and other major supply in crudeoil, technical also supporting the bearish view.
We can see Flag Pole breakdown on 1 hr time frame.
This is only for educational purpose
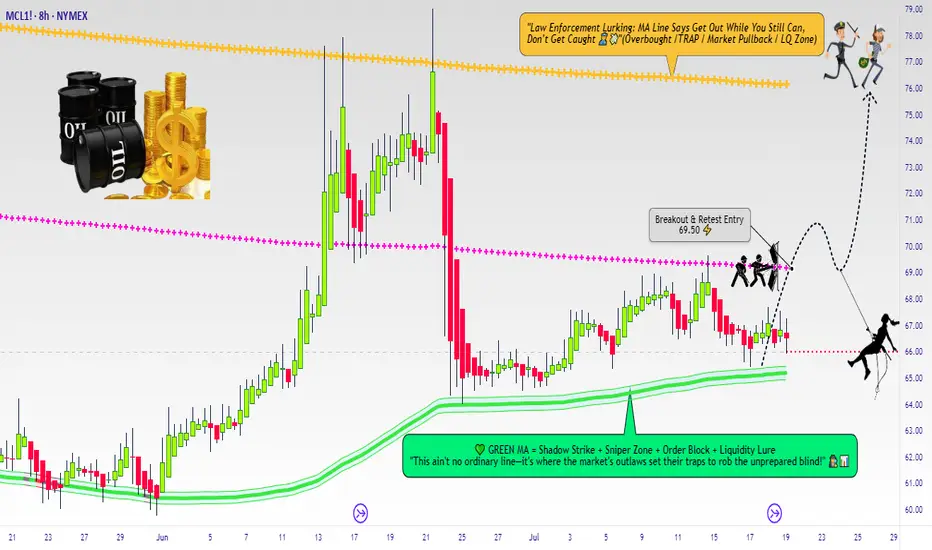
Micro WTI Swing Breakout Setup – Robbing Liquidity the Smart Way🛢️ "Crude Ops: The WTI Energy Vault Breakout Plan" 🛢️
(A Thief Trader Swing Setup | MA Breakout Trap Heist 💰💥)
🌍 Hola! Bonjour! Marhaba! Hallo! Hello Robbers & Market Movers! 🌟
Welcome to another high-voltage heist mission straight from the Thief Trading Den. This ain’t just a chart—this is an Ener
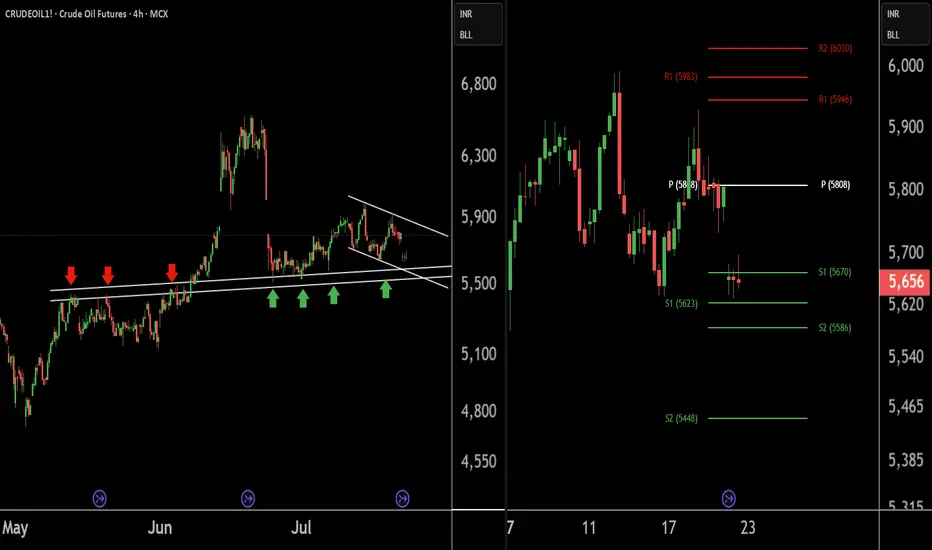
Crude Oil Buying Alert: Strategic Entry Point IdentifiedThere are two charts of Crude Oil on the 4-hour timeframe.
In the first chart, Crude Oil is sustaining near its lower point (LOP), with a support range of 5540-5580.
A-VWAP is also providing support to Crude Oil around the 5580 level.
The Pivot Point is also supporting Crude Oil around the 5580-5
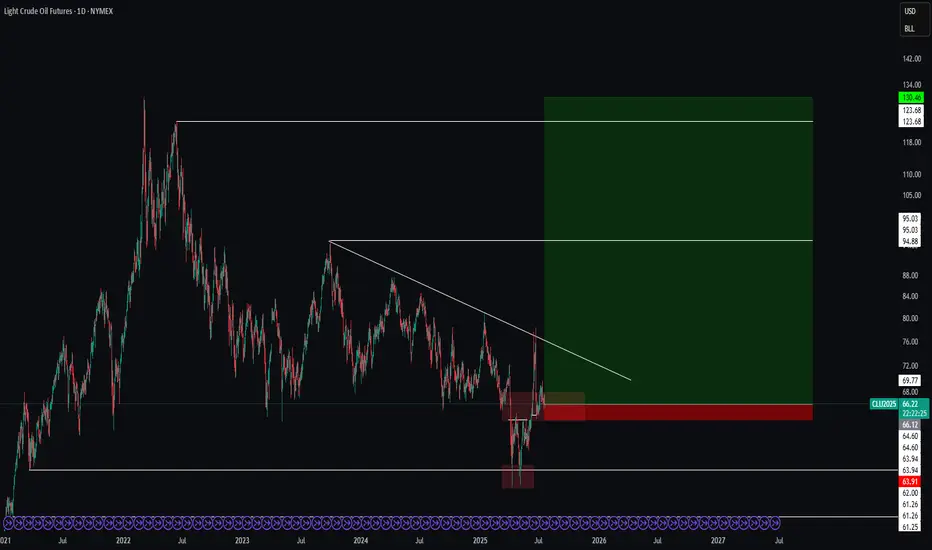
[CL] USOIL ideaHere is my point of view on US Oil future ( NYSE:CL ) with a very large TP with intermediate ones to manage the position.
Let's start to build a position on this levels right now and see how it reacts to add more on the push up.
Great Trade !
See all ideas
Summarizing what the indicators are suggesting.
Neutral
SellBuy
Strong sellStrong buy
Strong sellSellNeutralBuyStrong buy
Neutral
SellBuy
Strong sellStrong buy
Strong sellSellNeutralBuyStrong buy
Neutral
SellBuy
Strong sellStrong buy
Strong sellSellNeutralBuyStrong buy
A representation of what an asset is worth today and what the market thinks it will be worth in the future.
Displays a symbol's price movements over previous years to identify recurring trends.
Frequently Asked Questions
The current price of Crude Oil Futures (Jan 2031) is 62.12 USD / BLL — it has risen 0.26% in the past 24 hours. Watch Crude Oil Futures (Jan 2031) price in more detail on the chart.
Track more important stats on the Crude Oil Futures (Jan 2031) chart.
The nearest expiration date for Crude Oil Futures (Jan 2031) is Dec 19, 2030.
Traders prefer to sell futures contracts when they've already made money on the investment, but still have plenty of time left before the expiration date. Thus, many consider it a good option to sell Crude Oil Futures (Jan 2031) before Dec 19, 2030.
Open interest is the number of contracts held by traders in active positions — they're not closed or expired. For Crude Oil Futures (Jan 2031) this number is 0.00. You can use it to track a prevailing market trend and adjust your own strategy: declining open interest for Crude Oil Futures (Jan 2031) shows that traders are closing their positions, which means a weakening trend.
Buying or selling futures contracts depends on many factors: season, underlying commodity, your own trading strategy. So mostly it's up to you, but if you look for some certain calculations to take into account, you can study technical analysis for Crude Oil Futures (Jan 2031). Today its technical rating is sell, but remember that market conditions change all the time, so it's always crucial to do your own research. See more of Crude Oil Futures (Jan 2031) technicals for a more comprehensive analysis.