NATGAS Trading Opportunity! SELL!
My dear friends,
NATGAS looks like it will make a good move, and here are the details:
The market is trading on 1.836 pivot level.
Bias - Bearish
Technical Indicators: Supper Trend generates a clear short signal while Pivot Point HL is currently determining the overall Bearish trend of the market.
Goal - 1.653
Recommended Stop Loss - 1.929
About Used Indicators:
Pivot points are a great way to identify areas of support and resistance, but they work best when combined with other kinds of technical analysis
———————————
WISH YOU ALL LUCK
HH1! trade ideas

Natural Gas Price Forecast | DXY Crude Oil XAUUSD XAGUSDNatural Gas Price Forecast | DXY Crude Oil XAUUSD XAGUSD
00:00 Natural Gas stock Bulls NatGas Support & Resistance Guide
04:55 AMEX:UNG Stock Forecast
07:08 USO Oil Stock Forecast
09:20 DXY US dollar Stock Forecast
10:54 Gold XAUUSD Stock Forecast
12:28 Silver XAGUSD

NATGAS Resistance Ahead! Sell!
Hello,Traders!
NATGAS keeps going up
In a bullish correction but
The price will soon hit
A strong horizontal resistance
Level of 2.016$ and after
That retest a bearish reaction
And a move down are
To be expected
Sell!
Like, comment and subscribe to help us grow!
Check out other forecasts below too!

NATGAS: Short Trade with Entry/SL/TP
NATGAS
- Classic bearish formation
- Our team expects fall
SUGGESTED TRADE:
Swing Trade
Sell NATGAS
Entry Level - 1.836
Sl - 1.896
Tp - 1.718
Our Risk - 1%
Start protection of your profits from lower levels
❤️ Please, support our work with like & comment! ❤️

✅NATGAS POTENTIAL SHORT🔥
✅NATGAS will soon retest a key resistance level of 2.021$
So I think that the pair will make a pullback
And go down to retest the demand level below at 1.709
SHORT🔥
✅Like and subscribe to never miss a new idea!✅

\\\ NATURAL GAS ///V SHAPE riversal may not be possible JUST wait to make double bottom or some other BULLISH patterns
FULLY INTRUSTED IN BY BUT NOT WITHOUT CONFERMATION...


Long natural gas from 1.4-1.3 in the summer of 2024Since 2012, natural gas has been leap years every 4 years (2012, 2016, 2020, 2024?) in spring and summer, it goes to the support line in the area of 1.4. Then the 2nd bottom and from summer back to the north...

When will there be the long-awaited rebound in gas prices?If you would like to be notified whenever I post a new article, just click "FOLLOW" at the top. Also, if you would like to elaborate on a particular topic or need some advice, please comment below the article and I will be happy to help you.
When will there be the long-awaited rebound in gas prices?
After a sharp drop of 7.5 percent in the previous session, the U.S. Natural Gas Future - Apr 2024 (NGJ4) rose slightly above the $1.65/MMBtu mark. Traders are facing an oversupply situation with high storage levels and weak demand due to a mild winter.
However, producer efforts to limit production are providing some support. Despite a brief interruption in January due to Arctic frost, gas production still remains at historic highs. The mild weather has led inventories to be well above average, as evidenced by EIA's latest report showing storage levels 22.3 percent above normal.
As a result of prices falling to their lowest in 3 1/2 years, Chesapeake Energy has reduced its production plans
With natural gas prices near multi-year lows, it is fair to ask whether this is a good buying opportunity.
To get an accurate forecast of the future of the gas market, it is critical to analyze the outlook of its producers. These companies provide valuable data that can help us determine whether the stock is overvalued or undervalued.
In addition, by considering the correlation between these companies and natural gas futures, we can get a better idea of the trend of the natural gas market.
If you are thinking of investing in this sector, avoid doing so through futures. We are currently in a Contango situation. This means that future prices are higher than the current futures price, causing an upward curve.
As we get closer to the expiration date of the contract, the gap between the spot and future prices will narrow, causing the curve to converge back to the spot price.
If you are looking to invest in gas, your best choice would be to buy shares in gas producers. In this article, we will take a look at Antero Resources Corp using One of TRADINGVIEW's features to better understand the financial aspects of the company.
TRADINGVIEW is like having a high-level technical analysis expert at your fingertips. Because of its intelligence, it automatically analyzes the company providing you with important data that would otherwise take months of study to calculate.
As you can see from the images, the stock is in the sell zone as shown by the oscillators and this indicates a potential downtrend.
This means that it is still too early to buy natural gas. The ideal time might be the second quarter of the year.
With the arrival of a hot summer, the demand for natural gas to power air conditioning systems could increase significantly. As a result, we expect the price of natural gas to increase starting in April.
It should be kept in mind that the demand for natural gas for summer cooling is much lower than the demand for winter heating in the United States. According to the average seasonal data for the past 5 years, January is the month with the highest demand for natural gas, while July slightly exceeds August as the peak summer month. Overall, total gas consumption in the United States in January is 35.5 percent higher than the demand recorded in July.
An opportunity to increase gas prices could come from a major player in the energy sector such as Chesapeake Energy Corp, which recently announced a 20 percent reduction in capital asset investment. This will result in a decrease in the number of drilling rigs, thus reducing gas production and oversupply in the market.
I look forward to seeing you in the next article! And remember, always rely on TradingView for your trading: an essential tool that can help you avoid serious mistakes in your trading.
You can purchase it through this link
www.tradingview.com

Natural Gas Price Forecast | DXY Crude Oil XAUUSD XAGUSD
Natural Gas Price Forecast | DXY Crude Oil XAUUSD XAGUSD
00:00 Natural Gas stock Bulls NatGas Support & Resistance Guide
06:13 AMEX:UNG Stock Forecast
08:12 USO Oil Stock Forecast
10:01 DXY US dollar Stock Forecast
11:54 Gold XAUUSD Stock Forecast
13:04 Silver XAGUSD

NATGAS Set To Grow! BUY!
My dear friends,
NATGAS looks like it will make a good move, and here are the details:
The market is trading on 1.582 pivot level.
Bias - Bullish
Technical Indicators: Supper Trend generates a clear long signal while Pivot Point HL is currently determining the overall Bullish trend of the market.
Goal - 1.638
About Used Indicators:
Pivot points are a great way to identify areas of support and resistance, but they work best when combined with other kinds of technical analysis
———————————
WISH YOU ALL LUCK

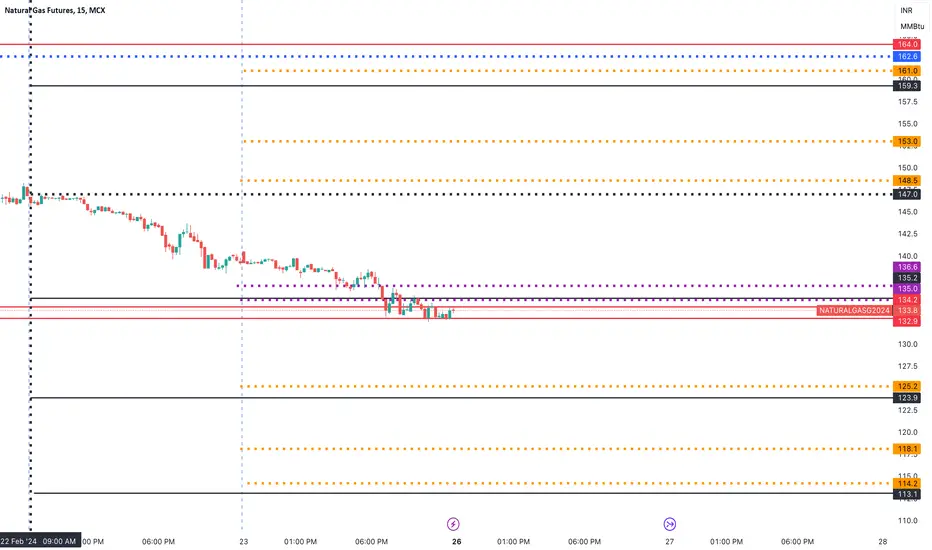
NATURALGAS Future - Intraday Levels - 26th Feb 2024If Sustain above 136 then 147 to 148 then 153 then 159 to 162 then 164
If Sustain Below 133 then 125 to 123 then 118 then 114 to 113
Consider some buffer points in above levels.
Please do your due diligence before trading or investment.
**Disclaimer -
I am not a SEBI registered analyst or advisor. I does not represent or endorse the accuracy or reliability of any information, conversation, or content. Stock trading is inherently risky and the users agree to assume complete and full responsibility for the outcomes of all trading decisions that they make, including but not limited to loss of capital. None of these communications should be construed as an offer to buy or sell securities, nor advice to do so. The users understands and acknowledges that there is a very high risk involved in trading securities. By using this information, the user agrees that use of this information is entirely at their own risk.
Thank you.
/NG: Secondary Bearish Entry Targeting Gap-Fill and a BAMMNatural Gas has gapped up to the 21 SMA during tonight's futures open and appears to be setting up for one last decline to fill the gap, but I think it will likely overshoot the gap and come down to the HOP level of the Bat down at around $1.50 to compete the BAMM, from there we may see natural gas attempt a bottom.

Natural Gas, OIL Silver DXY Gold Price Forecast:Natural Gas, OIL Silver DXY Gold Price Forecast:
Support & Resistance Guide
00:00 Natural Gas stock Bulls NatGas Support & Resistance Guide
06:13 AMEX:UNG Stock Forecast
08:12 USO Oil Stock Forecast
10:01 DXY US dollar Stock Forecast
11:54 Gold XAUUSD Stock Forecast
13:04 Silver XAGUSD

NATGAS: Forecast & Trading Plan
Balance of buyers and sellers on the NATGAS pair, that is best felt when all the timeframes are analyzed properly is shifting in favor of the buyers, therefore is it only natural that we go long on the pair.
❤️ Please, support our work with like & comment! ❤️

Natural Gas Futures Bearish Square Up to $1.6 is LikelyNatural Gas has recently gone up a lot, the problem is that much of this was done in pre- and post-market sessions, with square-up candles printed along the way. It is very likely that as Natural Gas breaks back below $1.70 that we see the price-action square up to the $1.6 area.

Natural Gas Price Forecast | DXY Oil XAUUSD XAGUSDNatural Gas Price Forecast | DXY Oil XAUUSD XAGUSD
00:00 Natural Gas stock Bulls NatGas Support & Resistance Guide
04:12 AMEX:UNG Stock Forecast
08:53 USO Oil Stock Forecast
10:55 DXY US dollar Stock Forecast
12:31 Gold XAUUSD Stock Forecast
13:42 Silver XAGUSD

Natural gas FibonacciNatural gas has a nice correction after the traders cash out their position after a big rally in price.
In this analysis i use Fibonacci retracements to see in the short term were the price can go.
The price hit 0.618 zone Fibonacci retracements in the correction down move so i expect to go back on the 0.618 zone Fibonacci expansion.
My TP is 1.720
Don't forget guys, this is just my opinion.
Good luck!

Natural Gas LONG TERM TRADE analysisHello Traders
In This Chart NATGAS HOURLY Forex Forecast By FOREX PLANET
today NATGAS analysis 👆
🟢This Chart includes_ (NATGAS market update)
🟢What is The Next Opportunity on NATGAS Market
🟢how to Enter to the Valid Entry With Assurance Profit
This CHART is For Trader's that Want to Improve Their Technical Analysis Skills and Their Trading By Understanding How To Analyze The Market Using Multiple Timeframes and Understanding The Bigger Picture on the Charts

NATURALGAS Future - Intraday Levels - 22nd Feb 2024**Levels marked at 6.55 PM IST
If Sustain above 144 then 147 then 150 then
If Sustain Below 144 then 138 to 133 then 130 then 126
Consider some buffer points in above levels.
Please do your due diligence before trading or investment.
**Disclaimer -
I am not a SEBI registered analyst or advisor. I does not represent or endorse the accuracy or reliability of any information, conversation, or content. Stock trading is inherently risky and the users agree to assume complete and full responsibility for the outcomes of all trading decisions that they make, including but not limited to loss of capital. None of these communications should be construed as an offer to buy or sell securities, nor advice to do so. The users understands and acknowledges that there is a very high risk involved in trading securities. By using this information, the user agrees that use of this information is entirely at their own risk.
Thank you.

Natural Gas (NG) Long Trade AnalysisNatural Gas (NG) Long Trade Analysis
Entry:
In this analysis, we target a long trade for Natural Gas (NG) from the level of 1.727.
Technical Analysis:
Strong Support at 1.727:
The level of 1.727 appears to be a robust support on the chart.
We observe repeated bounces from this level in the past.
Positive Technical Formations:
A positive technical formation is evident on a lower timeframe, such as a crossover of the Relative Strength Index (RSI) in the buying zone.
Overall Trend is Positive:
The overall market trend supports positive expectations, reinforcing the potential for an upward move from this level.
Strategy:
Based on the technical analysis, we propose entering a long trade from the level of 1.727.
Target and Risk Management:
Target:
Targeting the nearby resistance level at 2.290.
Risk Management:
Placing the stop-loss near the last support level to ensure capital protection.
Conclusion:
Based on the current technical analysis, entering a long trade for Natural Gas (NG) from the level of 1.727 is anticipated. It is recommended to monitor the market closely and adjust the strategy according to market developments.
note:
This analysis is merely an opinion and does not constitute a trading recommendation.
You should conduct your own analysis before making any trading decisions.
Make sure you use proper risk management to protect your account.

GOOG Is Starting To Bottom OutThe TrendCloud System is specifically designed for Trend Following and Trend Reversal Trades.
It will show you when the Trend has become extended and heading for a major level of support. In this case, its the 100 SMA.
Start looking for the option chain on around this area or just wait for the TrendCloud Signal to go long.
If you want to trade trend reversal setups then click the link in my profile and start using the same trade plan that is already making money in 2024.
We are over 10% in just 2 weeks of trading.
Click the link in my profile for the free video trade plan.

Natural Gas HUGE WIN Today!!Huge Move on Natural Gas just now. Here is the step by step setup.
4 hour trend was extended. MACD bullish divergence was also very strong.
1 hour CCI was above +100
15 minute TrendCloud signals were sent right to my phone and alerted me to the trade.
Small $200 risk and we are now over $1000 in the green.
If you like trading trend reversal trades then click the link in my profile and I will send you the trade plan for this exact set up.
Enjoy
Chris Juliano
