Natural Gas (NG) Long Trade AnalysisNatural Gas (NG) Long Trade Analysis
Entry:
In this analysis, we target a long trade for Natural Gas (NG) from the level of 1.727.
Technical Analysis:
Strong Support at 1.727:
The level of 1.727 appears to be a robust support on the chart.
We observe repeated bounces from this level in the past.
Positive Technical Formations:
A positive technical formation is evident on a lower timeframe, such as a crossover of the Relative Strength Index (RSI) in the buying zone.
Overall Trend is Positive:
The overall market trend supports positive expectations, reinforcing the potential for an upward move from this level.
Strategy:
Based on the technical analysis, we propose entering a long trade from the level of 1.727.
Target and Risk Management:
Target:
Targeting the nearby resistance level at 2.290.
Risk Management:
Placing the stop-loss near the last support level to ensure capital protection.
Conclusion:
Based on the current technical analysis, entering a long trade for Natural Gas (NG) from the level of 1.727 is anticipated. It is recommended to monitor the market closely and adjust the strategy according to market developments.
note:
This analysis is merely an opinion and does not constitute a trading recommendation.
You should conduct your own analysis before making any trading decisions.
Make sure you use proper risk management to protect your account.
JKM1! trade ideas

GOOG Is Starting To Bottom OutThe TrendCloud System is specifically designed for Trend Following and Trend Reversal Trades.
It will show you when the Trend has become extended and heading for a major level of support. In this case, its the 100 SMA.
Start looking for the option chain on around this area or just wait for the TrendCloud Signal to go long.
If you want to trade trend reversal setups then click the link in my profile and start using the same trade plan that is already making money in 2024.
We are over 10% in just 2 weeks of trading.
Click the link in my profile for the free video trade plan.

Natural Gas HUGE WIN Today!!Huge Move on Natural Gas just now. Here is the step by step setup.
4 hour trend was extended. MACD bullish divergence was also very strong.
1 hour CCI was above +100
15 minute TrendCloud signals were sent right to my phone and alerted me to the trade.
Small $200 risk and we are now over $1000 in the green.
If you like trading trend reversal trades then click the link in my profile and I will send you the trade plan for this exact set up.
Enjoy
Chris Juliano

Natural Gas Price Forecast00:00 Natural Gas stock Bulls NatGas Support & Resistance Guide
04:12 AMEX:UNG Stock Forecast
06:35 USO Oil Stock Forecast
07:40 DXY US dollar Stock Forecast
09:14 Gold XAUUSD Stock Forecast
10:24 Silver XAGUSD
#naturalgas #natgas #xagusd #dxy #xauusd #naturalgastechnicalanalysis #technicalanalysis #tradingstrategy #daytrading #naturalgasanalysis #naturalgastrading #natgasanalysis #uso #crudeoil

NATURAL GAS: Ahead of a 12 month Bull Market at least.Natural Gas is on a very sharp four month decline after failing to cross over the 1M MA50, the second most aggressive four month drop so far in the past 19 years. Since the July 2008 High, the market is trading inside a Channel Down and this sharp decline is technically the final phase of the Bearish Wave to a LL at the bottom of the Channel Down. That means that a long term buy opportunity is gradually approaching and we are estimating a fair target level to be 1.400 unless the 1M RSI touches the 15 year Buy Zone earlier. Every bottom rebound extended initially to at least +134% and that is our target (TP = 3.100) for the next 12 months. It will also be a potential test of the 1M MA200.
See how our prior idea has worked out:
## If you like our free content follow our profile to get more daily ideas. ##
## Comments and likes are greatly appreciated. ##

Natural Gas Major Trend Reversal SetupToday we use our TrendCloud Reversal signals to set up a beautiful trade on Natural Gas and also take a Trend Following trade on Platinum.
If you want to trade the same type of setups then feel free to click the link in my profile and take advantage of this working trade plan that is making money in 2024.
Enjoy!
Chris Juliano

Corrective pattern in the larger wave degreeI hope this message finds you well and that you're having a great start to the week. I wish you success in your business endeavors.
As someone interested in the Elliott Wave principle, I find it a valuable tool for analyzing the market. I have developed my approach by combining this principle with my personal experience and by considering various scenarios that are likely to occur in the market.
I am sharing my analysis with you, but please note that I am not providing any buy or sell signals. I aim to share my unbiased analysis with you so that you can use it as a guide to make informed decisions.
In the attachment, you will find my previous analysis of the same market, so you can compare and see the differences. All the details of my analysis are clearly labeled, making it easy for you to understand (although having a basic familiarity with the Elliott Wave Principle theory will help you understand the analytical idea more easily).
I have been studying the Elliott Wave principle for almost three years now. With time, my understanding of this knowledge and experience has increased. What I have achieved so far is a legacy of a genius named Ralph Nelson Elliott, and I am truly satisfied with my progress. May his soul rest in peace and his memory be cherished.
Thank you for your support so far. I am grateful and will always remember your kindness. Please feel free to share your thoughts and feedback with me.
I hope my analysis will be useful to you in your business journey, and I wish you all the best.
Sincerely,

Natural Gas LONG TERM TRADE analysis Hello Traders
In This Chart NATGAS HOURLY Forex Forecast By FOREX PLANET
today NATGAS analysis 👆
🟢This Chart includes_ (NATGAS market update)
🟢What is The Next Opportunity on NATGAS Market
🟢how to Enter to the Valid Entry With Assurance Profit
This CHART is For Trader's that Want to Improve Their Technical Analysis Skills and Their Trading By Understanding How To Analyze The Market Using Multiple Timeframes and Understanding The Bigger Picture on the Charts

Can Nat Gas Find Support?Natural gas futures have fallen by more than 30% year-to-date. Can the futures contract bounce off a historic support level, or are we facing liquidation risk?
Recent Developments:
As the western hemisphere had one of the warmest winters on record, the demand for natural gas had fallen precipitously. The recent export ban on natural gas producers, as well as stricter flaring regulations, has increased supply to an unsustainable level, and many are wondering if the commodity can go negative.
Positioning of Managed Money:
It would seem as though the downside risk is limited. As of February 13, 2024, managed money (CTAs and Hedge Funds) is now sitting at a net long position of +368,000 futures and options contracts, betting that the bottom is in. This is also toward the higher end of the range, going back to January 2020, when MM was net long +371k, and close to the April 2012 net long level of +391k.
Technicals:
The identified support range is $1.40-$1.50 on the front month futures contract. A break and close below this level could lead to long liquidation, pushing prices closer to $1.00. If we manage to stay above this support pocket, a break and close above $2.00 would be encouraging.
Check out CME Group real-time data plans available on TradingView here: www.tradingview.com
Disclaimers:
CME Real-time Market Data help identify trading set-ups and express my market views. If you have futures in your trading portfolio, you can check out on CME Group data plans available that suit your trading needs www.tradingview.com
*Trade ideas cited above are for illustration only, as an integral part of a case study to demonstrate the fundamental concepts in risk management under the market scenarios being discussed. They shall not be construed as investment recommendations or advice. Nor are they used to promote any specific products, or services.
Futures trading involves substantial risk of loss and may not be suitable for all investors. Trading advice is based on information taken from trade and statistical services and other sources Blue Line Futures, LLC believes are reliable. We do not guarantee that such information is accurate or complete and it should not be relied upon as such. Trading advice reflects our good faith judgment at a specific time and is subject to change without notice. There is no guarantee that the advice we give will result in profitable trades. All trading decisions will be made by the account holder. Past performance is not necessarily indicative of future results.

natural gas By HesamUNThey traders
look at this long-term move
is that even possible?
what u think about natural gas ? share ur chart and leave a comment

NATURALGGAS 170-168 IS IMPORTANT SUPPORT ,break this level downside next support 115 rs ,again naturalgas flying take this any one support

NATGAS LONG TERM TRADE analysHello Traders
In This Chart NATGAS HOURLY Forex Forecast By FOREX PLANET
today NATGAS analysis 👆
🟢This Chart includes_ (NATGAS market update)
🟢What is The Next Opportunity on NATGAS Market
🟢how to Enter to the Valid Entry With Assurance Profit
This CHART is For Trader's that Want to Improve Their Technical Analysis Skills and Their Trading By Understanding How To Analyze The Market Using Multiple Timeframes and Understanding The Bigger Picture on the Charts

Natural Gas Price Forecast | DXY Oil XAUUSD XAGUSD00:00 Natural Gas stock Bulls NatGas Support & Resistance Guide
05:34 AMEX:UNG Stock Forecast
08:29 USO Oil Stock Forecast
10:24 DXY US dollar Stock Forecast
11:56 Gold XAUUSD Stock Forecast
12:52 Silver XAGUSD
#naturalgas #natgas #xagusd #dxy #xauusd #naturalgastechnicalanalysis #technicalanalysis #tradingstrategy #daytrading #naturalgasanalysis #naturalgastrading #natgasanalysis #uso #crudeoil

Natural Gas: Historic Triple Decade Support LevelHistoric Price Opportunity:
NYMEX:NG1! (Natural Gas) is at a crucial level, with prices hovering at a point not consistently broken since a monthly close in July 1995. The weekly chart reinforces this, showing rare closures below this threshold over the last 30 years.
Technical Indicators:
RSI Bullish Divergence: The weekly RSI divergence suggests underlying strength.
Historical Resilience: This price area has been a formidable support zone.
Sub-$2 Entry: Historically, entries below $2 have been lucrative over decades.
Fundamentals at a Glance:
Electricity's Backbone: In the US, natural gas fuels 40% of electric power, significant against the backdrop of consistent year-over-year growth in electricity consumption since 1950, barring 11 years.
Green Energy Transition: Natural gas stands to gain from the global shift towards cleaner energy sources.
Soaring Exports: Global year-on-year rise in Liquefied Natural Gas (LNG) exports meets increasing international energy needs.
Counter-Trend Investing Perspective:
Every investor has heard at one time that the best time to invest is when something isn’t so hot and trendy. Well, the weather has been hot and because of that nobody thinks natural gas is trendy.
Trade Strategy Snapshot:
Entry: At any level in the $ 1.50s or a firm weekly close above the support zone above $1.60, displaying support confidence.
Target: Volume profile's highest point of control level of approximately $2.70.
Stop: A stop loss at physiological $1.50 or the $1.44 final low before levels not seen since the 1990s.
HODL: A long term holding strategy of greater than a year has historically been successful, where looking for exits along the way has been ideal. As natural gas is a useful commodity this is appealing.
Trading involves risks and not certainties; let's navigate the probabilities. Comment with your insights so we can uncover symmetries and diversities of ideas.

NG1Wolfe Wave's and constant changing waves .
Eliott Waves to support the Wolfe Wave Count .
Fibs to support the possible Point's of Intersection .

Natural Gas (NG) - Trading Idea - Go Long!Natural gas futures are declining due to warm weather forecasts indicating less demand for heating, leading to an oversupply. Prices fell as forecasts did not support a cold weather demand spike, with the March Nymex contract price dropping. Analysts suggest the market is trying to discourage production because of the low demand. The expectation for colder weather to boost prices was not met, as forecasts predict warmer conditions across much of the U.S. This situation is seen as a downward spiral for North American natural gas markets, with analysts calling for producers to reduce output. Future forecasts also indicate warmer than normal temperatures, further challenging the market. Despite potential increases in LNG export demand and a slight decrease in production, analysts believe a stable weather forecast and support levels are needed for prices to potentially recover.
Adding to the situation, there's potential geopolitical tension escalating in the Middle East with the possibility of conflict expanding to Israel against Hezbollah. Such an event could drastically impact global energy markets, including natural gas, potentially causing a significant surge in prices overnight due to concerns over supply disruptions. This geopolitical risk adds a layer of uncertainty to the already volatile natural gas market.
Furthermore, analysts are eyeing a critical support level for natural gas prices at $1.61/MMBtu. Should prices stabilize or geopolitical tensions escalate leading to concerns about supply, it could set the stage for a rebound in prices. If the market finds a bottom at this price level, there's potential for a recovery up to $2.200/MMBtu, especially if demand increases due to unexpected colder weather or supply constraints stemming from geopolitical developments. This scenario underscores the complex interplay between weather forecasts, supply dynamics, and geopolitical tensions in determining natural gas prices.

Natural Gas Price Forecast | DXY Oil Gold XAGUS00:00 Natural Gas stock Bulls NatGas Support & Resistance Guide
06:06 AMEX:UNG Stock Forecast
08:47 USO Oil Stock Forecast
10:14 DXY US dollar Stock Forecast
11:38 Gold XAUUSD Stock Forecast
12:29 Silver XAGUSD

☄ Natural Gas Futures: This Is Ground Control To Major TomThis publication was partially created by ChatGPT AI, under request to Highlight Ten Factors That Could Drive Natural Gas Prices Below Zero in 2023.
Good or bad, y'all be the judge. But here's what ChatGPT said...
As an AI, I cannot guarantee the accuracy of such statements, but based on common knowledge, the following factors may be the reasons why natural gas prices drop below zero in 2023:
1. Growth in the use of alternative energy sources such as solar and wind energy.
2. Increasing US shale gas production, which will lead to an increase in global supply.
3. Reduced demand for natural gas due to switching to other types of fuel.
4. Increasing natural gas production in highly competitive countries such as Russia and Qatar.
5. The weakening of economic activity in various countries of the world, including China, the US and Europe.
6. Reducing inflation in various countries, which reduces the cost of natural gas.
7. A record increase in natural gas inventories caused by a reduction in demand and an increase in production.
8. Disputes between countries-suppliers and consumers of natural gas, which may lead to a decrease in exports and imports.
9. Increasing competition in the natural gas market from other producers such as Iran and Iraq.
10. Development of new technologies that make it possible to obtain energy from other sources without the use of natural gas.
Technical picture in Natural Gas Futures indicates the biggest YTD decline over the all history of Natural Gas Futures trading since early 1990x.
The main chart is adjusted for futures change All History Chart.

NATURAL GAS Ultimate Cycles cheat sheet shows sell isn't over.Those who follow us for long know that when trading Natural Gas (NG1!) we use a very distinct long-term pattern that has been in effect for more than ten years and last time (January 22 2023, see chart below) has helped us take a new short at 3.174, running so far +100% in profit:
As you see on this 1W chart, the price is now below the High Volatility Zone, but the bottom isn't in yet as there is still room before touching the 15 year Lower Lows trend-line nor has the Sine Wave reached its bottom. At the same time the 1M RSI is breaking below its own Higher Lows trend-line, which is a bearish signal. We estimate a Target Zone within 1.300 - 1.250. Note that a 1W Death Cross was formed in August 2023 and since the March 2009 formation, NG prices a bottom significantly (at least 9 months) later.
-------------------------------------------------------------------------------
** Please LIKE 👍, FOLLOW ✅, SHARE 🙌 and COMMENT ✍ if you enjoy this idea! Also share your ideas and charts in the comments section below! This is best way to keep it relevant, support us, keep the content here free and allow the idea to reach as many people as possible. **
-------------------------------------------------------------------------------
💸💸💸💸💸💸
👇 👇 👇 👇 👇 👇

NATGAS long idea!Check out the chart drawings for the full idea!
NATGAS has run into a zone that was initially formed back in the early 90s and has been respected as the all time chart low/floor since '95.
NATGAS is also running into a 3 year old trendline that could also help motivate the bulls.
NATGAS also has bullish divergence.

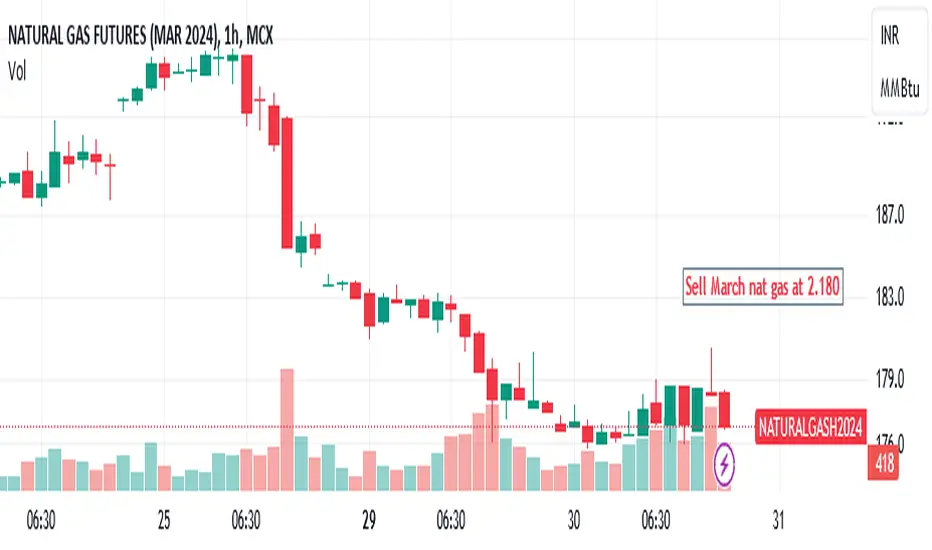
Sell March nat gas at 2.180 if filled, place stop at 2.29 tg2.01Sell March nat gas at 2.180 - looking for a bounce of oversold, if filled, place stop at 2.29 and tgt at 2.01
Will a new low of 1.50 be possible for natural gas prices?Will a new low of 1.50 be possible for natural gas prices?
I am excited to share with you my weekly article.
In the first part of this article, we will highlight the most promising futures and stocks at the moment.
Despite recent tensions in the bond market, Wall Street once again set a new record high this week. However, Europe remains in a state of uncertainty. While the luxury goods and automobile sectors continue to experience strong growth, financial stocks are suffering significant losses. In the absence of a significant macroeconomic catalyst, volatility appears to have abated. Inflation data expected in the United States this week will be critical to further understanding the current economic landscape.
The oil market, Future Crude Oil WTI - Mar 2024, continues to fluctuate, with prices continually rising and falling. This week has seen an increase and the forecast from last week's article seems to be close to reality with prices around $80. The situation remains uncertain in the Middle East, with Israel rejecting a cease-fire offer in Gaza and the United States eliminating pro-Tehran groups in Iraq. At the same time, the U.S. Energy Agency revised downward its production outlook for 2024, forecasting a peak of less than 13.3 million barrels per day.
The natural gas future, Future Natural Gas - Mar 2024 still looks uncertain, especially for the next few years. As expected, U.S. natural gas futures prices fell to $1.83/MMBtu-the lowest level reached since September 2020. At the same time, gas production is returning to pre-cold weather levels thanks to the restoration of gas wells that were shut down during the severe cold weather in mid-January. However, technical problems with the Freeport LNG export facility have restricted the flow of gas to LNG export facilities in the United States, and record levels are not expected to return until the facility is fully operational.
According to government data, U.S. utilities withdrew only 75 billion cubic feet (bcf) of gas from storage last week. This is significantly less than the 217 bcf withdrawn during the same week last year. In addition, the report indicates that the level of gas in storage is still 10.6 percent higher than the seasonal norm. Weather forecasts indicate that temperatures will remain above average until late February.
A paradoxical analysis emerges from the rig count. In its weekly survey, Baker Hughes reported a 4-unit increase in the total number of active rigs in the United States, which now stands at 623. There was stability in the number of crude oil rigs (499) while gas rigs increased by 4 to 121.
At a time when gas production is very high, rigs continue to increase, causing an oversupply. This excess can have serious consequences on the market, making it more difficult for producers to sell their gas at the desired price.
There is no good news coming from the weather, as forecasts indicate that the period between February 17 and 24 will be less cold than expected.
There is likely to be a technical rebound in the short term for natural gas prices, but in the medium term I remain pessimistic and believe they may fall as low as 1.50. We may see a price recovery only from April onward.
I look forward to sharing the second part of this article next week, where I will look at index futures.

Looking for a natural gas long trade2.12.24 I am looking for a buy signal for a long trade or natural gas. The video goes over this in a lot of detail so we don't need to do that here. The videos more about setting up the chart to prepare for the reversal... before the reversal happens. My gut level feeling is this is going to be a great reversal trade because the markets at a very strong support even though it may still go a little bit lower before we find the buyers. The important thing for you to take into consideration if you're starting as a trader...Is that there's plenty of time to set the chart up before you have to take a trade... and that effort to set up the chart forces you to review the characteristics of the market that can help you so that you're not paralyzed by a surprise and then the market gets away from you before you realize it.... you're too late. The beautiful things about reversal patterns is that many traders are biased to the current trend of the market and they're not focused on where the real money is going to be made with a higher probability.... and that is the trade in the other direction.
