Contract highlights
Related commodities

NATURAL GAS Best buy opportunity of the Channel Up.Natural Gas (NG1!) touched yesterday the bottom (Higher Lows trend-line) of the 1.5-year Channel Up, marginally below the 1D MA200 (orange trend-line) and is reacting so far today with a bullish tone.
If this evolves in a full-scale rebound, then technically it will be the pattern's new Bullish Leg

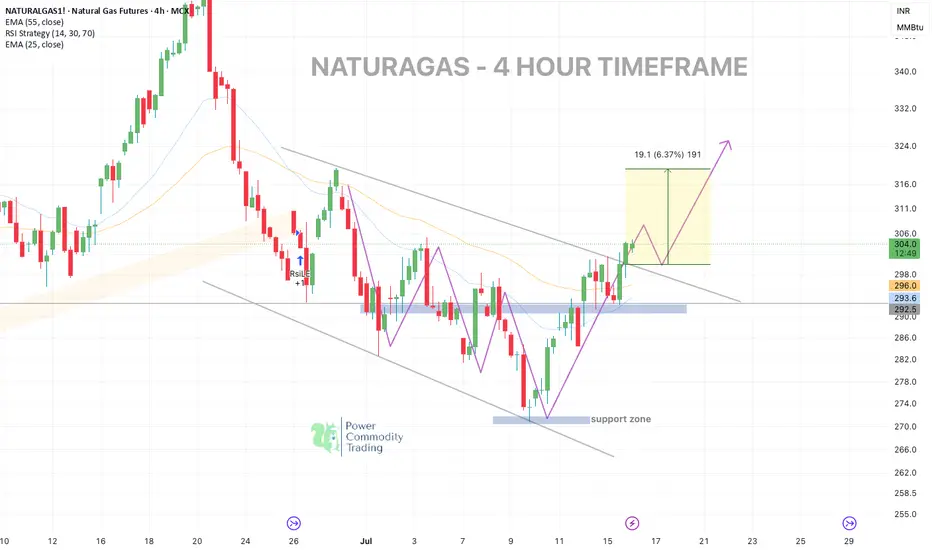
$NATURALGAS - 4H Breakout After Support ReclaimPattern formation: falling wedge pattern (4 Hour)
Price executed a clean reversal from the demand zone, reclaimed key EMAs, and broke out of the falling channel — hinting at a potential trend shift on the mid-timeframe.
✅ Support zone held strong near 270–280
✅ Breakout of falling wedge/channe
Gold | Oil | Dollar | Silver | Natural Gas July 2025 Forecast.Gold | Oil | Dollar | Silver | Natural Gas July 2025 Forecast.
NYMEX:NG1! COMEX:GC1! COMEX:SI1! NYMEX:CL1!

NG1! SHORT FROM RESISTANCE
NG1! SIGNAL
Trade Direction: short
Entry Level: 3.356
Target Level: 3.150
Stop Loss: 3.493
RISK PROFILE
Risk level: medium
Suggested risk: 1%
Timeframe: 2h
Disclosure: I am part of Trade Nation's Influencer program and receive a monthly fee for using their TradingView charts in my analysis.
✅L

NATGAS Support Ahead! Buy!
Hello,Traders!
NATGAS keeps falling but
The price will soon hit a
Horizontal support of 2.90$
From where we will be expecting
A local bullish rebound
Buy!
Comment and subscribe to help us grow!
Check out other forecasts below too!
Disclosure: I am part of Trade Nation's Influencer progr

LONG ON NATURAL FUTURESI THINK IN COMING DAYS THE CONFLICT IN MIDDLE EAST WILL REFURBISH WHICH SEEMINGLY HAVE AN EFFECT OVER ENERGY PRICES
Russian Sanctions can also prop up the prices
Pre-Market PrepToday’s market insights show a lot of potential opportunities across the board:
S&P 500: We’re in a strong upward imbalance, trading above the prior day’s range and value area. The focus is on long opportunities, but waiting for confirmation on any pullbacks.
NASDAQ & Russell 2000: Similar to the


NG1!: Move Up Expected! Long!
My dear friends,
Today we will analyse NG1! together☺️
The price is near a wide key level
and the pair is approaching a significant decision level of 3.403 Therefore, a strong bullish reaction here could determine the next move up.We will watch for a confirmation candle, and then target the ne

See all ideas
Summarizing what the indicators are suggesting.
Neutral
SellBuy
Strong sellStrong buy
Strong sellSellNeutralBuyStrong buy
Neutral
SellBuy
Strong sellStrong buy
Strong sellSellNeutralBuyStrong buy
Neutral
SellBuy
Strong sellStrong buy
Strong sellSellNeutralBuyStrong buy
A representation of what an asset is worth today and what the market thinks it will be worth in the future.
Displays a symbol's price movements over previous years to identify recurring trends.
Frequently Asked Questions
The current price of Henry Hub Natural Gas Futures (Sep 2033) is 3.299 USD / MMBTU — it has risen 0.59% in the past 24 hours. Watch Henry Hub Natural Gas Futures (Sep 2033) price in more detail on the chart.
Track more important stats on the Henry Hub Natural Gas Futures (Sep 2033) chart.
The nearest expiration date for Henry Hub Natural Gas Futures (Sep 2033) is Aug 29, 2033.
Traders prefer to sell futures contracts when they've already made money on the investment, but still have plenty of time left before the expiration date. Thus, many consider it a good option to sell Henry Hub Natural Gas Futures (Sep 2033) before Aug 29, 2033.
Open interest is the number of contracts held by traders in active positions — they're not closed or expired. For Henry Hub Natural Gas Futures (Sep 2033) this number is 0.00. You can use it to track a prevailing market trend and adjust your own strategy: declining open interest for Henry Hub Natural Gas Futures (Sep 2033) shows that traders are closing their positions, which means a weakening trend.
Buying or selling futures contracts depends on many factors: season, underlying commodity, your own trading strategy. So mostly it's up to you, but if you look for some certain calculations to take into account, you can study technical analysis for Henry Hub Natural Gas Futures (Sep 2033). Today its technical rating is strong buy, but remember that market conditions change all the time, so it's always crucial to do your own research. See more of Henry Hub Natural Gas Futures (Sep 2033) technicals for a more comprehensive analysis.