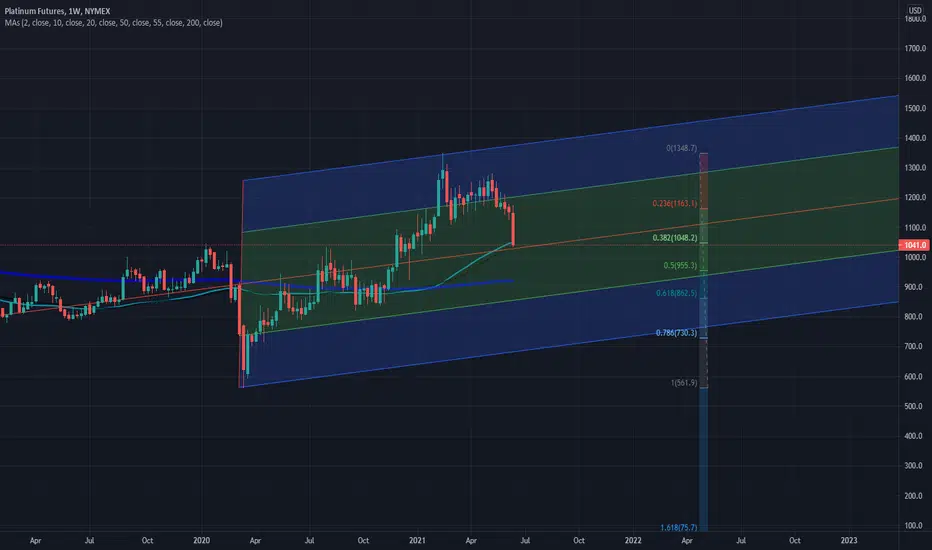
Platinum Wyckoff analysis, Accumulation! 2150 TARGET!Platinum is in Phase D of an accumulation.
It breached a 13 year long trend that lasted from the all time highs in 2008 to the upside.
I'll be entering my long term trade around the 935/920 area.
The price is coming down to retest the long-term trend-line, and will be hitting 2150 according to my point and figure calculations.
Platinum is one of the most used metals in the electric car manufacturing industry, which supports the bullish bias, given the fact that huge oil companies are switching to environmentally friendly solutions.
If you like the idea consider liking it, following me, and supporting me.
Peace.
TrickleDown FX
PL1! trade ideas

Long in platinum, looking for 1,500Risk/Reward are really good! I assume the correction is over and now is ready to rise to 1,500 or even more
Good Luck!

Short Platinum for reisstance bounceExpecting a bounce lower off this long term resistance. Probably into the coming weak given recent dollar weakness.

Platinum buy and hold - now at bargain priceThere is strong support holding platinum up. The momentum will continue soon.
Platinum currently selling at a fair price to buy and hold in long term. I suspect it will hit the next two targets within a few months.

Platinum Future: Is the current correction over ???I thinks it is possible. Action in the next few days till tell.
Also watch closely the DXY.
Process your way.

💨𝙋𝙡𝙖𝙩𝙞𝙣𝙪𝙢 𝙁𝙪𝙩𝙪𝙧𝙚 - Long Term 🐂 Trend🌊 𝙋𝙡𝙖𝙩𝙞𝙣𝙪𝙢 𝙁𝙪𝙩𝙪𝙧𝙚 (𝙋𝙇1!) — 𝙀𝙒𝘼
The senior wave degree is borrowed from the counting of the structure for gold and silver , which have a much longer history of quotations. The second slide shows how the correction, presumably the fourth wave of the “Supercycle” degree, is taking place in most metals, and the commodity market as a whole.
Further, taking into account the fact that the upward wave from the orthodox top (IV) is a single zigzag, it is correct to make an assumption about the formation of the ending diagonal (V) , within which wave III unfolds.
PL1! : 🕐2W
Wave ((A)) in the composition of III of (V) must also take the form of a diagonal . At least, the double zigzag that has passed from the end of wave II , in the context of the senior degree, can be interpreted as the first subdivision in its composition.
PL1! : 🕐1D
The first targets at 38.2% in wave (2) have been reached, the double zigzag W-X-Y of (2 ) looks complete. Growth is expected to resume by the intermediate wave (3) , the minimum targets for which are to go beyond the top of wave (1) .
PL1! : 🕐4h
The wave marking in the double circle parenthesis corresponds to the green marking in the circle on the chart.

Platinum's "Structural Momentum" Defined Bull EraHopefully Michael Oliver approves my work!
In any case, looks like the bull era for platinum has just started and is completing it's first important pull back.


Platinum looks promisingPlatinum is climbing higher. Today we should see acceleration to confirm the impulsive character of the move.

Platinum ready to pop higherIndicators suggest that the correction on PL might come to the end.
I'm waiting for price action and volume to confirm the assessment.

Platinum's Big Picture Chart Quarterly candles with a custom 15 month moving average. The strong move was made from bear zone to bull zone.
Now time to rest and test those important breakout levels (now support).
Still have a 1430$.


Platinum. Go long with pullback currently. Platinum retested the support at 1140. this is a very strong support technically for platinum.
Additionally, the fundamentals for platinum has not really changed. Buying platinum here with the aim to ride back the demand for the metal which ensures a greener world and lower carbon economy, be it due to the catalytic converters for the internal combustion engines, or be it for the battery technologies that will replace the current mobility solutions

Platinum. Go long with pullback currently. platinum went all the way down to 1149. close to predicted zone. 1145 has not been breached since 10 march and this should be a good place to go long.

Platinum Futures at a Crucial Threshold The price of Platinum is currently trading near a major make-it-or-break-it point, whose further development entails excellent trading opportunities.
On the one hand, the breakdown of the price below the lower boundary of the Flag and the 100-day MA (in blue) signifies a potential correction to the 38.2% Fibonacci retracement.
On the other, the Stochastic RSI suggests that the market is oversold. Given that the price is also consolidating above the 23.6% Fibonacci at present, bulls can use this as an indication that the market may have already bottomed out. Hence, they can look for an opportunity to enter long right away

Platinum Fell From Price Channel After a tightening price range in the uptrend channel, platinum prices have fallen below the price channel flipping the trendline from support to resistance. Next line of support is around 1100. If inflation fears ease, or if stocks take off and crypto continues it's selloff, more money will flow into those markets and I think there may be further downward pressure in platinum. That's my very uneducated opinion. Not financial advice. Be safe and happy trading!


Platinum nearing resistance on the 4H?I sold my puny amount of platinum on the 4th when we approached the orange trendline, which is a resistance line from the previous rally before the pandemic. Recently we've had 4 reactions with this trendline acting as resistance and you'll notice we failed to reach the top of the channel (blue) in the last three upward swings. So is this the moment this resistance is breached? I don't know. Is this the moment platinum is rejected around 1267 and starts to form a pattern resembling an ascending wedge? I don't know that either. I'm super new to this so I don't know anything. But just in case I took some money off the table while I hold in SLV and pick up more IAU, at least until we have a break above this line, and confirmation of the uptrend.
Looks like divergence of MACD on the 4H chart but the 1D looks good! Advice welcome!


Traditional|PL1!|Long and shortLong and short PL1!
Activation of the transaction only when the blue zone is fixed/broken.
The author recommends the use of anchoring fixed the blue zone, this variation is less risky.
If there is increased volatility in the market and the price is held for more than 2-3 minutes behind the activation zone after the breakdown, then the activation of the idea occurs at the prices behind the activation zone.
Working out the support and resistance levels of the consolidation zone.
* Possible closing of a trade before reaching the take/stop zone. The author can close the deal for subjective reasons, this does not completely cancel the idea and is not a call to the same action, you can continue working out the idea according to your data, but without the support of the author.
+ ! - zone highlighted by the ellipse is a zone of increased resistance, in this area there is a possible reversal for a correction, please take this factor into account in this transaction.
The "forecast" tool is used for more noticeable display of % (for the place of the usual % scale) of the price change, I do not put the date and time of the transaction, only %.
The breakdown of the upper blue zone - long.
Breakdown of the lower blue zone - short.
Working out the stop when the price returns to the level after activation + fixing in the red zone.
Blue zones - activation zones.
Green zone - take zone.
Red zone - stop zone.
Orange arrows indicate the direction of the take.
Red arrows indicate the direction of the stop.
Priority - The value of the priority parameter implies the author's subjective opinion about the more likely activation zone on this idea, this does not mean that this idea will be 80% activated by this parameter, the purpose of the parameter is to provide for the risk of the inverse of the zone parameter.
Example: "Priority Long: So the author inclines more in the direction of the activation zone open long trades, in this case, when reaching the activation zone in short you should be very careful, because this area may be highly likely to be punched about the breakdown/do not get to take/activate transaction from go to stop."
Please consider this parameter if you use my ideas.
SUM PNL: This parameter displays the total % of all closed ideas of the "new" format (according to the author) for this sector at the time of publication of the idea. The calculation is very "clumsy" just the sum of the profits of all the ideas, based on this indicator, you can more accurately assess the risks when working with my ideas of this sector. I present you the construction of the idea, you can use it yourself as you like based on your subjective view and risks, the calculation of the PNL indicator is carried out only on transactions that the author closed on TV in manual mode or by take.
P.S Please use RM (risk management) and MM (money management) if you decide to use my ideas, there will always be unprofitable ideas, this will definitely happen, the goal of the system is that there will be more profitable ideas at a distance.

Platinum ready to breakout from it's bull flagPlatinum took a pause after hitting the 1300s. Since then it has been moving in a triangular wedge. But it seems that the bull penant is almost done. and its ready to breakout. Fundamentally, the news that the BIden administration is going to reduce carbon emissions by 50% indicates a lot of electrodes, storage devices, infrastructure spend are on the way. That can only mean, that platinum is in for a massive breakout over the next few trading sessions. Is today the Day? might be. I am buying platinum.
