RB Demand is down because inflation is up and people are driving less to make up for the cost.
Trend regression channel since Nov 04, 22
Entry 2.15
SL 2.21
TP 1.93
RB1! trade ideas

Bearish RBOB Gasoline Futures BearflagThis is kind of an extension to the US Crude-Oil Bearish Bat trade from the other day; So we have a Bear Flag on the Gasoline Futures chart and we seem to be confirming a Break Hook and Go that has room to take us to $2.00 if it holds.


Gasoline / US Dollar TIMEFIBSTimeFibs of the cycle 0-1. Consider the golden ratio of the time. Note that previous time Phi reversed the market. Let's see how the market reacts to 1/ Phi (1.618) Fibonacci is the order in chaos like a language of fractal. Dates of TimeFibs ratios as well as time periods are provided.
1.618 AT 6 OCT '22
Fibonacci channels Cover the Fractal Configuration of the waves of the cycle.
Note how when market is bearish Triple Cross UO turns red. Until the point where it gets closer to lower green dynamic band.
Try
I use this indicator to see the balance between Bulls and Bears in relation to each other.

Gasoline on the rise! Bullish CypherGasoline futures on the rise again as things heat up across the oil markets.
Bullish Cypher with a type 2 confirmation low.
Bullish divergence on the MACD, with a inverse head and shoulders style reversal on the RSI.
A common retracement here would be between the 382 and 618 at 2.91 - 3.40

Daily RB analysisDaily RB analysis
Sell trade with target and stop loss as shown in the chart
The trend is down and we may see more drop in the coming period in the medium term
All the best, I hope for your participation in the analysis, and for any inquiries, please send in the comments

RBOB Bollinger Band SqueezeThe RB1! Bollinger Bands bandwidth has narrowed to the narrowest width in 11 months as can be seen via the BandWidth indicator. Such a collapse in volatility usually precedes a volatility breakout in either direction. A Bollinger Band squeeze, which is a type of volatility breakout setup, is triggered when the bandwidth puts in a 6-month low which is a condition that has been achieved. This criterium is defined in the book “Bollinger on Bollinger Bands” by John Bollinger in the chapter "The Squeeze." The book states that a squeeze may oftentimes head fake and that a parabolic SAR (PSAR) may be used as a reversal trigger for an open trade or a trigger point for opening a new position in the direction price was heading when it hit the PSAR. Volume indicators and other technicals should be used to try and determine the direction of the squeeze and that is what I’ve done. Accumulation/Distribution% which is detailed in the book and linked below as an indicator I’ve published is trending down which is not necessarily the suggested use of the indicator but it was the best hint I could find about the direction of the breakout. %B is also trending down which again isn’t the intended use of the indicator but there’s not much else to go by. There’s a trendline which suggests going short and the 20-day sma is sloping downward which also suggests going short although it is pretty close to rolling up. Last time I noticed a squeeze setup was in soybeans and it broke out in the direction of the prior couple months which was down and is currently down with RBOB. The soybean idea is linked below.
I’ve come up with down as the anticipated direction of the squeeze breakout with a stop (and reverse if practical) at the PSAR (blue dots trailing stop) and a target of 1.9315 at the lower channel line which should fall above the previous low of 1.8799.
I will not actually be trading this because the notional value of 1 contract is $99,531 which is too high for me right now and it’s not a high conviction trade idea, more of a “I think this is what’s gonna happen, but it can go either way” type deal. It can head fake in one direction and break out in the other. If anyone has any ideas on which direction the volatility breakout is likely to be in based on technicals or fundamentals, please share.
Accumulation/Distribution% indicator:
Soybean Bollinger Band Squeeze idea:

Daily RB analysisDaily RB analysis
Sell trade with target and stop loss as shown in the chart
The trend is down and we may see more drop in the coming period in the medium term
All the best, I hope for your participation in the analysis, and for any inquiries, please send in the comments
Daily RB analysis Daily RB analysis
Sell trade with target and stop loss as shown in the chart
The trend is down and we may see more drop in the coming period in the medium term
All the best, I hope for your participation in the analysis, and for any inquiries, please send in the comments

Are gasoline prices heading back to 2.00 dollars a gallon? $ugaWholesale gasoline futures could be telling us that the driving demand is bad and just not there to support these high prices. War and geo politics is pushing Crude Oil prices up as well as the heating related products, but gasoline is trading on its own forces currently. With the rejection at around 4.00 a gallon, is the support here or are we destined to look for support lower?

Wholesale gasoline price down 38% from June supports demandConsumers have proven to be more sensitive to price than previously predicted

Oil bottom is near? Lots of news that would push oil commodities higher and just looking at this from a technical standpoint of volume, price action; it looks like the bottom is nearly here give it 1-2 months.

Gas Futures....Not Looking Good....3 months to midterms!
Which is it? Decline/stagnation, or we pop back up to that 3.25 gap and keep pump prices well over $4?

RBOB Gasoline Futures Analyze On 1h Timeframethe blue Zone represent an intense point, we can see how many times the market tried to break the S line on this Up trend.
so i think there is a good chance of an Upcoming Down Trend.
Any Thoughts On this One!!

Gasoline almost back to pre-war levelsGasoline in the US has been trending lower and lower, now down 30% from its ATH. It hasn't filled the breakaway gap yet, but I think it will do so in the next few weeks, and that could be an excellent opportunity to go long in the short term.
Oil has filled the gaps and chopped at support for a while but is looking weak. What is strange is how supply is limited, the spot market is strong... yet the paper market (futures, etc.) is invalid. Maybe the weakness is due to broadly slowing growth and economic activity, though I am not sure the REAL recession is here yet. The energy crisis isn't over, especially not in Europe... and this could get worse before they get better.
Most issues remain the same, and there is very little progress. There are no new refineries; few nuclear plants are active again, Russia is still limiting gas flows to Europe, sanctions make oil flows harder, and OPEC+ cannot increase capacity fast. Our energy needs constantly grow, yet our production has plateaued. Very little can be done now to ease our problems, and our problems will become even worse if the SPR is drained and the US stops supplying the world with oil from its reserves. Most solutions require time, and politically many of these are not welcome by the green movement. Essentially, we have energy producers and green activists colluding to increase energy prices so that the first make more money and the second to make themselves feel good while simultaneously destroying people's lives and the environment.
I believe crude oil could get down to 75$ and even 55$ in the short term but ultimately will go much higher once the Fed and other central banks are forced to cut rates and print money. It's all about managing your positions until we get to that point, as a big recession could cause oil and gas prices to tank. Oil and gasoline prices rose so fast that it is almost impossible for such a move not to cause a recession and consequently demand destruction.
If we look at Gasoline prices in terms of other fiat currencies, we can see that they went 70% higher than their 2008 peak, which is a lot. I multiplied the RBOB with DXY to get a better picture of the actual cost of gas for everyone outside the US, as the US is less than 25% of the global economy. That means that for almost 90% of the population and 75% of the worldwide economy, gasoline costs 70% more than in 2008. This will have tremendous consequences, especially given the rate at which prices increase.
In conclusion, although I don't think prices have bottomed, and we could see a sharp decline in the next few months, I believe gasoline and oil prices will go much higher, and dips are for buying.

GASOLINE Head and Shoulders likely to turn long-term bearishGasoline (RB1!) has been rising since the March 2020 bottom on a straight Channel until late February 2022 where war and inflation worries turned it parabolic as illustrated by the use of the Fibonacci Channel extensions. Following the June 06 market top, a Head and Shoulders (H&S) pattern was formed that hit (and so far rebounded on) the 1D MA200 (orange trend-line), a level touched for the first time since December 23 2021.
A break below the Support, should target the lower extension of the 1D MA300 (green trend-line), if not a retest of the Shoulder Resistance and potentially rejection on the 1D MA50 (blue trend-line) would initiate the 1D MA300 drop.
This trend-line has been Gasoline's Support since December 08 2020. This however may be the perfect opportunity to break it finally as the H&S pattern typically end such parabolas in fashion to at least the 0.618 Fibonacci Retracement level. Interestingly enough, that happens to be currently on the 1W MA200 (red trend-line).
--------------------------------------------------------------------------------------------------------
Please like, subscribe and share your ideas and charts with the community!
--------------------------------------------------------------------------------------------------------

Gas futures down 7 of the last 9 weeksFirst of all, I used to always use CL1 as my main source of oil & energy. That measures Crude Oil futures. I think now is also an important reminder about the differences between Crude Oil futures and Gasoline Futures.
Before I really get started, let me say I am a big believer in new energy sources. I just don't think it makes sense to dig something up from the ground, burn it once, and then it's gone forever. Especially when it's possible to find sources of energy that are continually producing, no questions asks, no input or output required, just going at all times. The sun is one example.
Anyways, let's get back to the chart above that RB Gasoline Futures. This means reformulated gasoline, which is a cleaner type of fuel that is used in most cars and automobiles. So the chart is interesting because you can get feel for the price of gas, the cost to fill up a car, at any given moment. However, keep in mind that gasoline futures involve the delivery of 42,000 gallons of gasoline per contract. That's a lot! I don't know many traders who have enough space to store 42,000 gallons of gasoline. That's true for all futures contracts... they are huge quantities.
So if you look at RB1! you will see an interesting double bottom. That looks playable. But then again, 42,000 gallons per contract. Oil is coming on globally, cars are getting more efficient, and new energy sources are emerging.
My takeaway from all of this simple: a tradeable bounce is here. Quick swing trade. But I am not so sure that bounce will blast off quickly to the moon.
So this entire chart and energy market is in a strange situation. Did the bull rally come and go that fast? More importantly, what does that mean for all other markets from stocks to crypto?
I would add this chart to your Watchlist...


RBOB GASOLINE FUTURES (RB1!), H4 Potential for Bullish RiseType : Bullish Rise
Resistance : 3.4808
Pivot: 3.3401
Support : 3.2003
Preferred Case: On the H4, with prices bouncing off the ichimoku indicator and moving along the ascending trendline while the RSI is moving along an ascending trendline, we have a bullish bias that price will rise to the pivot at 3.3401 in line with the swing high resistance and 78.6% fibonacci projection. Once there is upside confirmation of price breaking the pivot structure, we would expect bullish momentum to carry price to 1st resistance at 3.4808 where the swing high resistance and -61.8% fibonacci expansion are.
Alternative scenario: Alternatively, price may drop to the 1st support level at 3.2003 in line with the swing low support and 78.6% fibonacci projection.
Fundamentals: No Major News

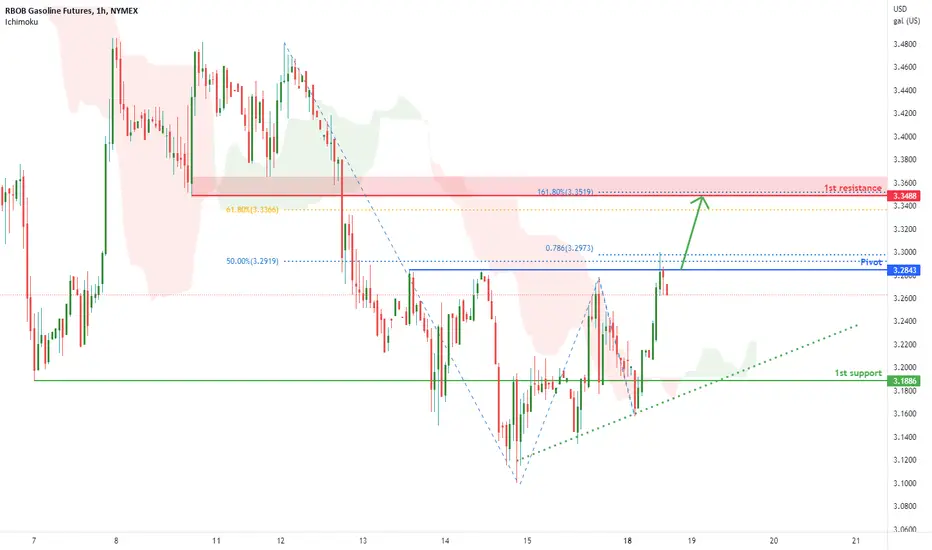
RBOB GASOLINE FUTURES (RB1!), H4 Potential for Bullish RiseType : Bullish Rise
Resistance : 3.3488
Pivot: 3.2843
Support : 3.1886
Preferred Case: On the H4, with prices moving above the ichimoku cloud and along the ascending trendline , we have a bullish bias that price will rise to the pivot at 3.2843 in line with the swing high resistance, 50% fibonacci retracement and 78.6% fibonacci projection . Once there is upside confirmation of price breaking pivot structure, we would expect bullish momentum to carry price to 1st resistance at 3.3488 in line with pullback resistance, 61.8% fibonacci retracement and 161.8% fibonacci extension .
Alternative scenario: Alternatively, price may drop to the 1st support level at 3.1886 in line with the pullback support.
Fundamentals: Investors are worried interest-rate hikes will slow the economy as central banks get aggressive in combating inflation , giving us a lower demand for gasoline and resulting in a bearish view on gasoline. We'll need to exercise caution for this setup because our fundamentals and technicals are not completely aligned.

RBOB GASOLINE FUTURES (RB1!), H4 Potential for Bullish RiseType : Bullish Rise
Resistance : 3.3488
Pivot: 3.2843
Support : 3.1886
Preferred Case: On the H4, with prices moving above the ichimoku cloud and along the ascending trendline , we have a bullish bias that price will rise to the pivot at 3.2843 in line with the swing high resistance, 50% fibonacci retracement and 78.6% fibonacci projection. Once there is upside confirmation of price breaking pivot structure, we would expect bullish momentum to carry price to 1st resistance at 3.3488 in line with pullback resistance, 61.8% fibonacci retracement and 161.8% fibonacci extension.
Alternative scenario: Alternatively, price may drop to the 1st support level at 3.1886 in line with the pullback support.
Fundamentals: Investors are worried interest-rate hikes will slow the economy as central banks get aggressive in combating inflation, giving us a lower demand for gasoline and resulting in a bearish view on gasoline. We'll need to exercise caution for this setup because our fundamentals and technicals are not completely aligned.
Gasoline Bearish Formation"Gasoline... breakfast of champions" - Joe Dirt
Consistent with our view of #Oil, gasoline shows us a beautiful bear wedge.
Are we all just expected to pay $4.50+ / gal of gasoline? This seems like a tall ask for the American consumer, considering prices are significantly elevated across most of the American ( & global ) economy.
Emerging markets getting beat up all around the globe
Commodities have started to selloff
Interest rates are rising
USD ripping higher
crypto bubble... popping...?
Let's see how it goes!
God bless!

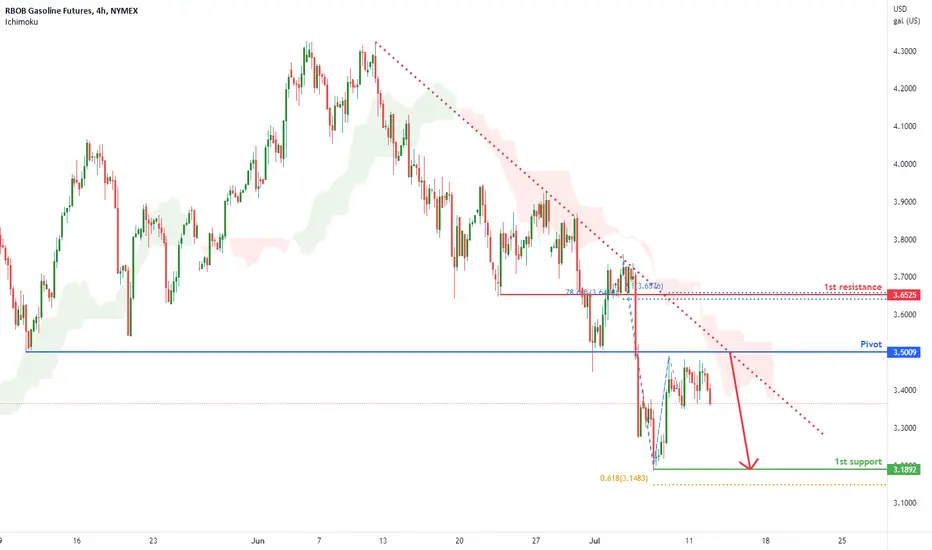
RBOB GASOLINE FUTURES (RB1!), H4 Potential for Bearish DropType : Bearish Momentum
Resistance : 3.6525
Pivot: 3.5009
Support : 3.1892
Preferred Case: On the H4, with price moving below the ichimoku cloud and along the descending trendline, we have a bearish bias that price will rise and drop from the pivot at 3.5009 in line with the overlap resistance to the 1st support at 3.1892 where the 61.8% fibonacci projection and swing low support are.
Alternative scenario: Alternatively, price may break pivot structure and rise to the 1st resistance at 3.6525 where the pullback resistance, 100% fibonacci projection and 78.6% fibonacci retracement are.
Fundamentals: U.S. gasoline demand is down roughly 4.5% from last week, giving us a bearish bias on gasoline.