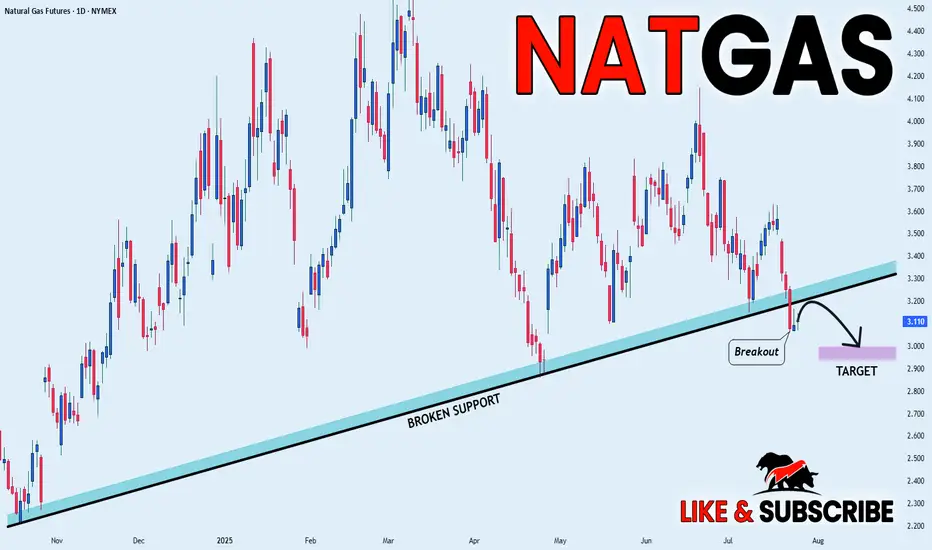
NATGAS BEARISH BREAKOUT|SHORT|
✅NATGAS broke the rising support
While trading in an local downtrend
Which makes me bearish
And I think that after the retest of the broken line is complete
A rebound and bearish continuation will follow
SHORT🔥
✅Like and subscribe to never miss a new idea!✅
Disclosure: I am part of Trade
Related commodities
NATGAS Support Ahead! Buy!
Hello,Traders!
NATGAS keeps falling but
A strong horizontal support
Level is ahead at 3.00$ so
After Gas retests the support
We will be expecting a local
Bullish rebound
Buy!
Comment and subscribe to help us grow!
Check out other forecasts below too!
Disclosure: I am part of Trade Natio

NatGas short term long opportunity Natgas MCX future may go upside target of 300+ from Cmp - 265 , SL - 259. If Buyer Accumulate and sustain level of 265 . Time horizon - 4-6 weeks

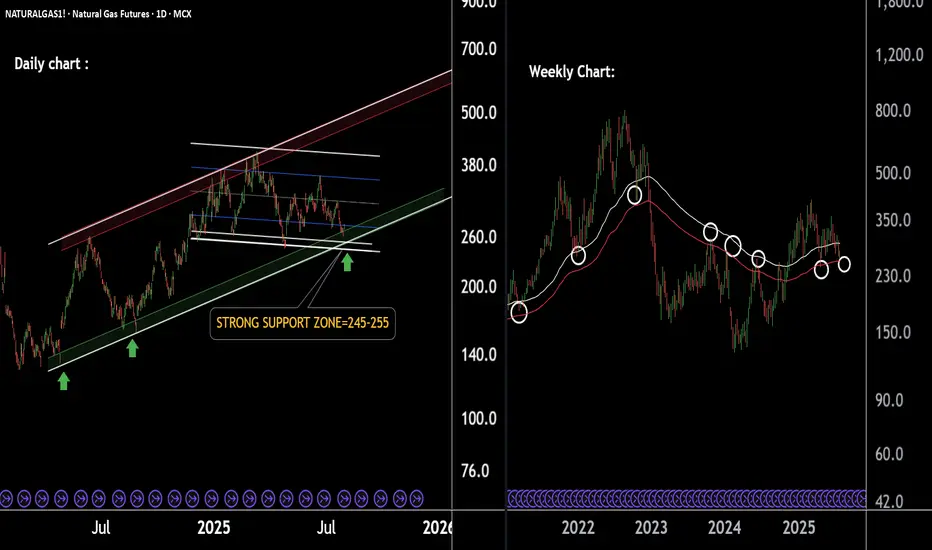
Natural Gas Cooling Near Support Zone – Bounce Ahead!Natural Gas Technical Overview (2-Chart Analysis):
Chart 1 – Parallel Channel Formation:
Natural Gas is moving within a well-defined parallel channel.
The lower support boundary of this channel is observed near 250, indicating a potential bounce zone.
Chart 2 – EMA-Based Support Structure:
Pric
Natural Gas | Oil | Dollar | Silver | Gold Price Forecast.Natural Gas | Oil | Dollar | Silver | Gold Price Forecast.
NYMEX:NG1! AMEX:UNG NYMEX:CL1! COMEX:GC1!

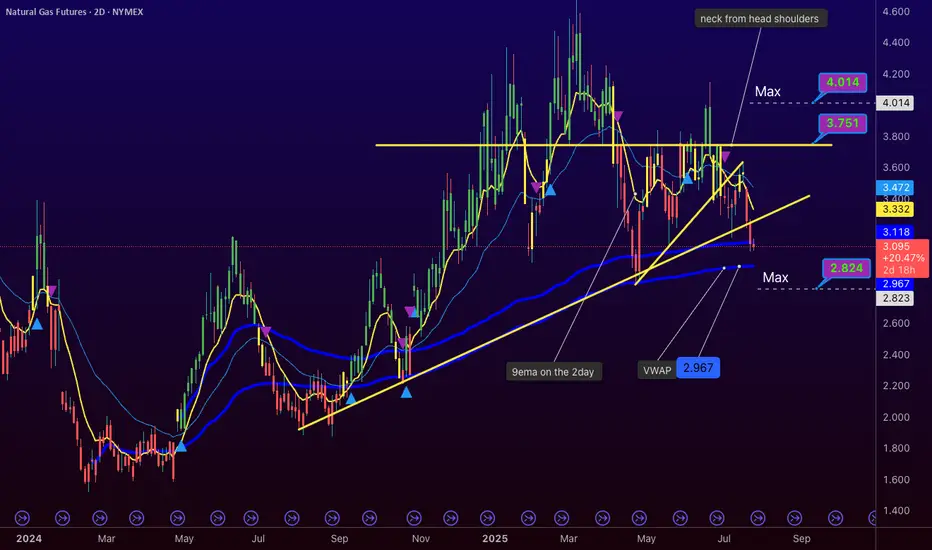
NG1! Bearish Break to $3.00-$2.82 by Tuesday?www.tradingview.com NYMEX:NG1! Update - Bears Pushing, Turnaround Looms Short-Term Odds: ~60% pullback to $3.00-$2.99, ~40% chance to $2.82 - Key Signal: Low volume on 1000-tick chart, holding below VWAP ($3.134). Third test at $3.10 done—$3.00 next if support breaks. - Trend Hint: Bearish with hig
NG : Long-term longFrom this level we can look for longs. But one should not expect a pullback from it during significant news.
But in normal time it will work.

NG1! BEST PLACE TO BUY FROM|LONG
NG1! SIGNAL
Trade Direction: long
Entry Level: 3.111
Target Level: 3.357
Stop Loss: 2.946
RISK PROFILE
Risk level: medium
Suggested risk: 1%
Timeframe: 1D
Disclosure: I am part of Trade Nation's Influencer program and receive a monthly fee for using their TradingView charts in my analysis.
✅LI

NATGAS Free Signal! Buy!
Hello,Traders!
NATGAS went down and
Almost reached the horizontal
Support of 3.014$ from where
We can enter a long trade
With the Take Profit of 3.066$
And the Stop Loss of 2.981$
Buy!
Comment and subscribe to help us grow!
Check out other forecasts below too!
Disclosure: I am part of Trad

#NATURALGAS 1st August ViewCAPITALCOM:NATURALGAS Currently looks doing a five swing structure from Feb low and any sell off should remain supported at this levels for atleast one more push higher.

See all ideas
Summarizing what the indicators are suggesting.
Neutral
SellBuy
Strong sellStrong buy
Strong sellSellNeutralBuyStrong buy
Neutral
SellBuy
Strong sellStrong buy
Strong sellSellNeutralBuyStrong buy
Neutral
SellBuy
Strong sellStrong buy
Strong sellSellNeutralBuyStrong buy
A representation of what an asset is worth today and what the market thinks it will be worth in the future.
Displays a symbol's price movements over previous years to identify recurring trends.
Frequently Asked Questions
The current price of UK NBP Natural Gas Calendar Month Futures is 83.880 GBP — it has risen 0.59% in the past 24 hours. Watch UK NBP Natural Gas Calendar Month Futures price in more detail on the chart.
Track more important stats on the UK NBP Natural Gas Calendar Month Futures chart.
Open interest is the number of contracts held by traders in active positions — they're not closed or expired. For UK NBP Natural Gas Calendar Month Futures this number is 0.00. You can use it to track a prevailing market trend and adjust your own strategy: declining open interest for UK NBP Natural Gas Calendar Month Futures shows that traders are closing their positions, which means a weakening trend.
Buying or selling futures contracts depends on many factors: season, underlying commodity, your own trading strategy. So mostly it's up to you, but if you look for some certain calculations to take into account, you can study technical analysis for UK NBP Natural Gas Calendar Month Futures. Today its technical rating is sell, but remember that market conditions change all the time, so it's always crucial to do your own research. See more of UK NBP Natural Gas Calendar Month Futures technicals for a more comprehensive analysis.