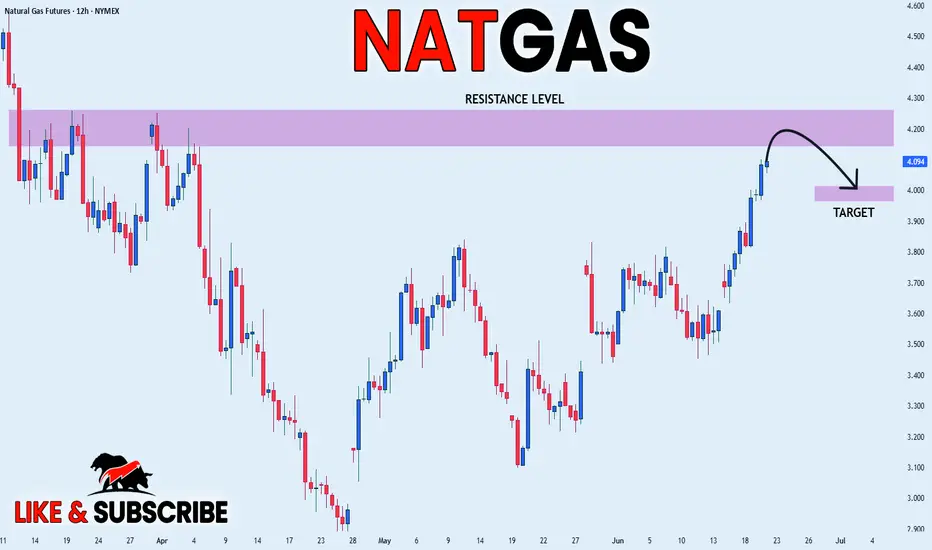
NATGAS STRONG RESISTANCE AHEAD|SHORT|
✅NATGAS has been growing recently
And Gas seems locally overbought
So as the pair is approaching
A horizontal resistance of 4.256$
Price decline is to be expected
SHORT🔥
✅Like and subscribe to never miss a new idea!✅
Disclosure: I am part of Trade Nation's Influencer program and receiv
Related commodities
Bullish Trend Remains IntactNatural Gas has been trading inside this rising channel for just over 2 years now. Tested the bottom of this channel for most of this year, now it’s looking to go back up to the top of the channel once again. I would stay long until it hits the top of the channel, unless it closes above the top of t

NATGAS Will Collapse! SELL!
My dear friends,
Please, find my technical outlook for NATGAS below:
The instrument tests an important psychological level 3.896
Bias - Bearish
Technical Indicators: Supper Trend gives a precise Bearish signal, while Pivot Point HL predicts price changes and potential reversals in the market.

Will Middle East Flames Ignite Winter Gas Prices?The global natural gas market is currently navigating a period of profound volatility, with prices surging and defying typical seasonal trends. This significant upward movement is primarily driven by escalating geopolitical tensions in the Middle East, specifically the intensifying conflict between

NATGAS Long From Support! Buy!
Hello,Traders!
NATGAS made a great
Bearish correction and
And then retested a
Horizontal support
Around 3.800$ from where
We are already seeing a
Bullish rebound so we
Are bullish biased and we
Will be expecting a
Further bullish move up
Buy!
Comment and subscribe to help us grow!
Check ou

Natural Gas | Oil | Dollar | Silver | Gold Price Forecast.Natural Gas | Oil | Dollar | Silver | Gold Price Forecast.
COMEX:SI1! COMEX:GC1! NYMEX:CL1! AMEX:UNG

Naturalgas long tradeNaturalgas is resisting downside movement as witnessed on chart.
If you see the downward movement of Naturalgas, it is with relatively high volume but it is not coming down as expected from sellers and bouncing back up again as seen 3 times.
Now naturalgas has reached short term resistance zone of 3

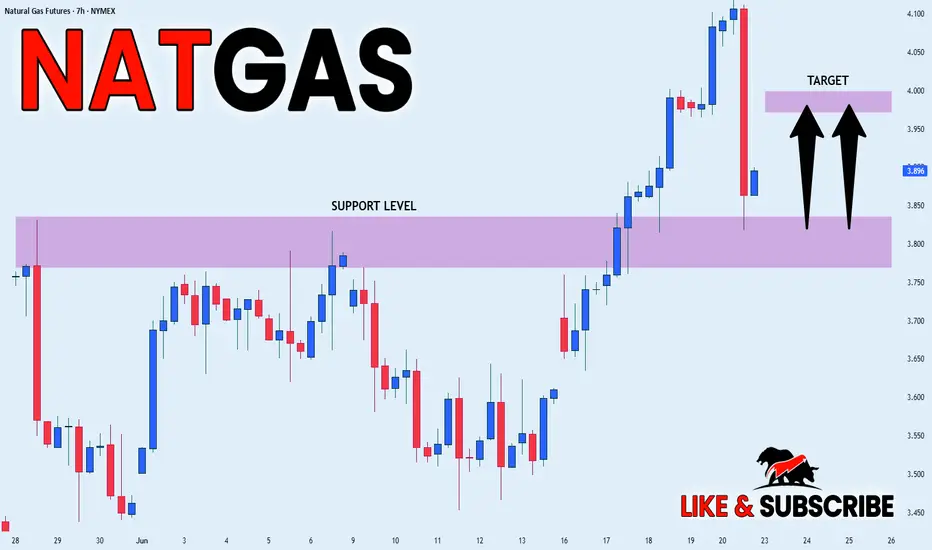
NATGAS REBOUND AHEAD|LONG|
✅NATGAS went down to retest
A horizontal support of 3.820$
Which makes me locally bullish biased
And I think that a move up
From the level is to be expected
Towards the target above at 3.984$
LONG🚀
✅Like and subscribe to never miss a new idea!✅
Disclosure: I am part of Trade Nation's
Natural Gas | Oil | Dollar | Silver | Gold Price Forecast.Natural Gas | Oil | Dollar | Silver | Gold Price Forecast.
NYMEX:NG1! NYMEX:CL1! COMEX:GC1! COMEX:SI1!

NG1!: Bulls Are Winning! Long!
My dear friends,
Today we will analyse NG1! together☺️
The market is at an inflection zone and price has now reached an area around 3.894 where previous reversals or breakouts have occurred.And a price reaction that we are seeing on multiple timeframes here could signal the next move up so we

See all ideas
Summarizing what the indicators are suggesting.
Neutral
SellBuy
Strong sellStrong buy
Strong sellSellNeutralBuyStrong buy
Neutral
SellBuy
Strong sellStrong buy
Strong sellSellNeutralBuyStrong buy
Neutral
SellBuy
Strong sellStrong buy
Strong sellSellNeutralBuyStrong buy
A representation of what an asset is worth today and what the market thinks it will be worth in the future.
Displays a symbol's price movements over previous years to identify recurring trends.
Frequently Asked Questions
The current price of UK NBP Natural Gas Calendar Month Futures (Jun 2026) is 88.260 GBP — it has risen 3.06% in the past 24 hours. Watch UK NBP Natural Gas Calendar Month Futures (Jun 2026) price in more detail on the chart.
Track more important stats on the UK NBP Natural Gas Calendar Month Futures (Jun 2026) chart.
The nearest expiration date for UK NBP Natural Gas Calendar Month Futures (Jun 2026) is May 28, 2026.
Traders prefer to sell futures contracts when they've already made money on the investment, but still have plenty of time left before the expiration date. Thus, many consider it a good option to sell UK NBP Natural Gas Calendar Month Futures (Jun 2026) before May 28, 2026.
Open interest is the number of contracts held by traders in active positions — they're not closed or expired. For UK NBP Natural Gas Calendar Month Futures (Jun 2026) this number is 0.00. You can use it to track a prevailing market trend and adjust your own strategy: declining open interest for UK NBP Natural Gas Calendar Month Futures (Jun 2026) shows that traders are closing their positions, which means a weakening trend.
Buying or selling futures contracts depends on many factors: season, underlying commodity, your own trading strategy. So mostly it's up to you, but if you look for some certain calculations to take into account, you can study technical analysis for UK NBP Natural Gas Calendar Month Futures (Jun 2026). Today its technical rating is buy, but remember that market conditions change all the time, so it's always crucial to do your own research. See more of UK NBP Natural Gas Calendar Month Futures (Jun 2026) technicals for a more comprehensive analysis.