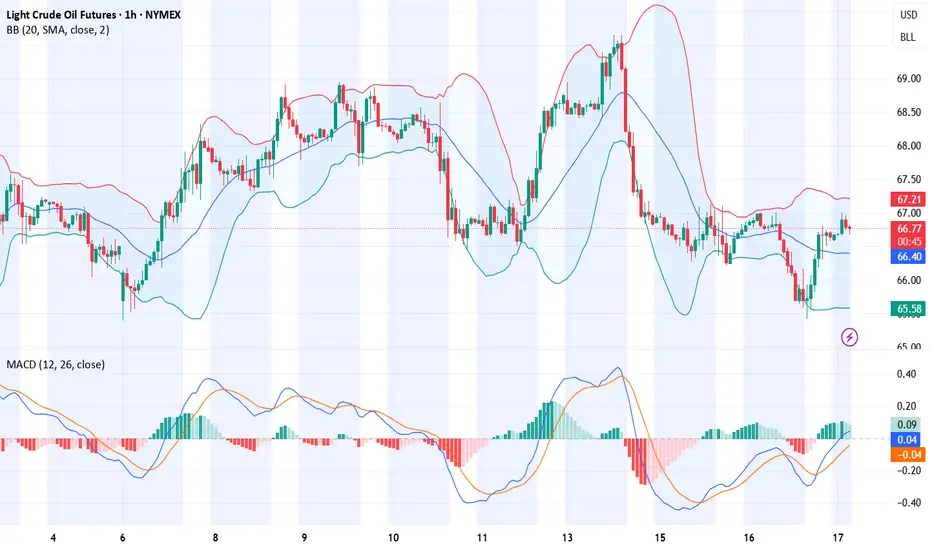
MCL Just RAN the Highs and Died. Beautiful. You ever watch price grind into a supply zone like it’s got no clue what's coming, then slap the trend line like it owes it money? That’s what MCL did this morning. It ran the previous day high, tapped into a juicy supply zone, gave us a textbook order block rejection and I said, “bet.”
I’m not here for 300 IQ Fibonacci spirals or Jupiter retrograde entries I just want clean structure, manipulated highs, and a breakdown that pays the bills. Let’s dig in.
Setup Overview (15-Min Chart)
Bias: Bearish
Setup Type: Liquidity Run ➝ OB Retest ➝ Trend Continuation
Context & Narrative:
PDH (67.01) was swept early. Liquidity grab? Price got yeeted from supply after faking momentum. We got a clean Order Block Retest at 66.59, respecting the descending EMA and HTF structure.
Entry Structure:
- Entry - 66.39 Retest rejection + momentum shift
- TP1 - 66.10 Intra-day structure low
- TP2 - 65.80 Demand zone front-run
- PDL - 65.40 Potential deeper fade if momentum holds
Confluence Checklist:
- Sweep of prior highs (PDH liquidity grab)
- Strong supply reaction + OB retest
- Bearish EMA slope holding price down
- Momentum shift + clean intraday structure
- Entry gives >2R to TP1, >4R to TP2
Risk Notes:
If price reclaims 66.70+ and closes above OB → bias invalidated. Don’t marry the trade this is oil, not Tinder.
WTI1! trade ideas

WTI(20250717)Today's AnalysisMarket news:
The annual rate of PPI in the United States in June was 2.3%, lower than the expected 2.5%, the lowest since September 2024, and the previous value was revised up from 2.6% to 2.7%. Federal Reserve Beige Book: The economic outlook is neutral to slightly pessimistic. Manufacturing activity declined slightly, and corporate recruitment remained cautious.
Technical analysis:
Today's buying and selling boundaries:
65.20
Support and resistance levels:
66.59
66.07
65.74
64.67
64.33
63.83
Trading strategy:
If it breaks through 65.74, consider buying in, and the first target price is 66.07
If it breaks through 65.20, consider selling in, and the first target price is 64.67
CL BULLISHHello,
I just noticed that oil has a good chance of rising, with a slight short-term uptrend, and I hope this helps you with your trading.
See you soon.

WTI(20250715)Today's AnalysisMarket news:
Sources said that after Trump's latest trade tax threat, the European Central Bank will discuss a more negative scenario next week than expected in June. The ECB is still expected to keep interest rates unchanged at its meeting on July 24. Discussions on rate cuts are still postponed to September.
Technical analysis:
Today's buying and selling boundaries:
66.63
Support and resistance levels:
69.20
68.24
67.62
65.65
65.02
64.06
Trading strategy:
If it breaks through 66.63, consider buying in, the first target price is 67.62
If it breaks through 65.65, consider selling in, the first target price is 65.02

CRUDEOIL1! at Best Support Zone !!This is the Daily Chart of CRUDEOIL1!.
CRUDEOIL1! having a good law of polarity at 5500-5600 level .
CRUDEOIL1! is currently trading between its quarterly pivot 5603 level and monthly pivot 5805 levels , indicating a range-bound movement."
Once the Crudeoil1! sustains above the monthly pivot, it may trigger a potential upside rally."
If this lop is sustain , then we may see higher prices in CRUDEOIL1!
Thank You !!

Crude Oil and the BOS bearish move might steps in?Watching the volume rising is a good confirmation for the Bearish Bias.
Follow @GoldenZoneFX For more Content and valuable insights.

Oil Went Back to 'Pre-conflict' Level on Israel-Iran Ceasefire The Israel-Iran ceasefire has triggered a sharp reversal in global oil markets, sending prices tumbling back to levels seen before the recent conflict. Brent crude ICEEUR:BRN1! fell below $70 per barrel and West Texas Intermediate NYMEX:CL1! dropped to around $65, erasing the risk premium that had built up during nearly two weeks of hostilities. This rapid decline—nearly 17% from the conflict’s peak—reflects investor relief that the threat of major supply disruptions, especially through the vital Strait of Hormuz, has receded for now.
However, the outlook remains uncertain. While the ceasefire has calmed immediate fears, the truce is fragile, with both sides accusing each other of violations within hours of its announcement. Shipping activity through the Strait of Hormuz is still subdued, insurance costs for tankers remain elevated, and some shipowners are steering clear of the region, indicating persistent caution in energy logistics.
If the ceasefire holds, markets may stabilize further, supporting global economic recovery and easing inflationary pressures.
But any renewed escalation or disruption in the Strait of Hormuz could quickly reverse these gains, keeping energy markets on alert for further geopolitical shocks.
The main technical graph for Dec'25 WTI Futures NYMEX:CLZ2025 indicates on 'cup and handle' technical structure with the nearest support around $62 per bll, and further 'double top' price action in upcoming development.
--
Best wishes,
@PandorraResearch Team 😎

40–50% Decline Possible for Crude OilLight Crude Oil Futures broke below a descending triangle and re-tested the breakdown level on volume twice as high as the 50 day moving average (daily chart). I anticipate a 40–50% decline to approximately $30–40 over the next 6–12 months, despite geopolitical tensions in the Middle East. This move aligns with a broader macro correction. Long-term, I remain bullish on oil.

Crude Oil Weekly OutlookNYMEX:CL1! NYMEX:MCL1!
With Nasdaq futures hitting all-time highs, our attention now turns to Crude Oil, which has seen a sharp pullback over the past week.
All-time highs in equity indices present a unique challenge:
There are no historical reference points—no prior price or volume data to lean against. Traders typically turn to tools like Fibonacci extensions, measured moves, or rely on market-generated information and emerging intraday levels before making decisions.
What Has the Market Done?
Crude Oil Futures (CL) posted a record drop last week, falling sharply from a Sunday open high of $78.40 to a Monday close low of $64.38—a $14.02 decline.
This sharp sell-off followed developments suggesting a potential Iran–Israel ceasefire and the end of a two-week conflict, prompting markets to rapidly unwind the geopolitical risk premium.
What is it trying to do?
CL Futures have since consolidated around the 2025 mid-range. The market appears to be in a balancing phase, digesting the removal of war-related premiums and recalibrating based on fundamentals.
How Good of a Job Is It Doing?
Having effectively priced out war risk, the market is now refocusing on fundamentals.
The global demand outlook is improving, driven in part by progress in trade deals.
OPEC’s June Monthly Oil Market Report (MOMR) forecasts global oil demand growth of 1.3 mb/d for 2025.
This transition from headline risk to fundamental drivers indicates market maturity and resilience, albeit within a still-volatile regime.
What Is More Likely to Happen From Here?
Today marks the final trading day of the month, and seasonal demand will become increasingly relevant.
Summer weather and travel activity are expected to drive demand for jet fuel and gasoline.
These seasonal tailwinds, if sustained, could help stabilize price action around key technical zones.
Key Levels:
yOpen: 67.65
pHi: 66.09
pIB Hi: 66
2025 mid-range: 65.39
pLow: 64.80
Overnight Low: 64.55
Naked VPOC: 64.50
Scenario 1: Continued Consolidation (Balance Holds)
Crude oil maintains range-bound behavior.
Strategy: “Outside-in” trading—fade moves at range extremes until new directional information emerges.
Scenario 2: Break from Balance
If directional conviction builds, price could break the current consolidation.
Upside target: Yearly open near $67.65.
Downside risk: March 2025 low if $64.40 fails.
All intraday levels noted above should be monitored for structure and participation.

#202526 - priceactiontds - weekly update - wti crude oil futuresGood Day and I hope you are well.
#mcl1 - wti crude oil futures
comment: Yeah I don’t know about this one. Your guess is as good as mine. I could even see this touching 63 before going higher again. Most erratic and extreme price action the past 2 weeks, so maybe wait a bit before jumping the train here.
current market cycle: trading range
key levels: 63 - 80
bull case: Bulls don’t have much. They could not close one decent bar at the high since 2025-06-11 and despite all the bull spikes, we only sold afterwards and are back below 65 where the extreme breakout happened. Best guess here is that we stay above 63 and go sideways. Sideways up to where? No idea. Could be 68, could be 70.
Invalidation is below 63
bear case: Too extreme. Both sides have to take quick profits or the next spike will take them away again. So most likely sideways in a range until a newsbomb hit again. Range could be 63 - 68.
Invalidation is above 79
short term: Neutral. Not touching this unless someone threatens me with a gun.
medium-long term - Update from 2025-06-22: Let’s leave this as “todo” for now. No read on this and I won’t make stuff up just to post something.

Crudeoil is near a strong support one can buy with a tight stopCrudeoil is near a strong support one can buy with a tight stop

OIL - is going to hit $50I expect the drop in OIl will go on
During such big news as potential WW3 price bararly rose
Also on bigger time frame price only reached 2nd vwap deviation
that's why after some consolidation price will go down toward range LOW

Geopolitical tensions is making oil fun to tradeFor the unexperienced traders, be very careful trading NYSE:CL , you can get caught anytime wether you are long or short right or wrong.
Nevertheless, if you follow my LIS, you can have a clear picture of where oil is heading to.
Right now, oil is set up as bearish but it can change in a matter of a bomb. Jokes aside, the LIS stands at 67.8. So below still bearish, above turn bullish.

OIL Bullish BiasCurrently sitting on my hands but closely watching oil, especially after Iran & Israel
Consolidation Protocol active. Need to see external range taken. I will not trade inside this range. Favoring longs.
Think accumulation, manipulation, distribution. Right now its in the accumulation phase. Manipulation phase is next. Preferably sweeping external low first then distribution higher to bsl.
Relative equal highs / LRLR at 114.29 first long term target.
Final target are the inefficiencies at 130 - 150.

CL1! Structural NarrativeResearch Idea
If look we beyond surface appearances, we would ask what kind of iterative, generative, or probabilistic mechanisms could have created those movements. Complexity can arise from simplicity, and that what looks messy may follow deep mathematical logic.
We can see the curve that connects series rejections that exposes where selling pressure extends compression until broken.
Another pattern would be current price expressed as a fibonacci ratio of a broader cycle as it splits them into phases.

Crudeoil bullish momentum coming with help of technicals Crudeoil creating RSI divergence
THE MOVEMENT WILL COME AFTER RSI CROSS ABOVE 55

CRUDE OIL poised to go UP AGAIN? Usually my posts on crude oil are short. but here’s a longer one for a change.
Back in December, I predicted that crude oil would hit the highlighted zone around $57. That’s exactly what happened, hit the target and bounced.
Over the past two weeks, we’ve seen wild swings in crude oil prices as tensions between Iran and Israel escalated. But now, following the ceasefire announcement brokered by President Trump, and considering Iran’s response over the past couple of days, crude oil has dropped below its pre-conflict price levels.
While I truly hope for a peaceful world where no innocent lives are harmed, my personal view is that this ceasefire feels fragile and may not last long.
So, what’s next for crude oil? Up or down?
If the ceasefire holds and we don’t see further conflict in the Middle East, I think crude oil could hover in the $65–$75 range. There’s even a slim chance we dip as low as $45.
However, based on my technical analysis model, and my doubts about the durability of the ceasefire, I expect oil prices to rise in the next 6 to 9 months. My targets? $78 and $85.
Of course, I might be wrong this time. :)
Cheers!

Oil Price: Breakout or Fakeout? Watch This Zone Closely Technical Overview:
The current price action is testing the upper boundary of a descending wedge, a bullish reversal pattern. The recent strong green candle indicates a potential breakout attempt, yet price is hovering near a critical resistance level at $74.20 (Fib 0.5).
Key levels from the Fibonacci retracement are:
🔼 Resistance at $74.20 (0.5), then $78.16 (0.618)
🧲 Local support at $69.78 (0.382)
🛡️ Strong demand zone near $63.81 (0.236) if rejection occurs
Structure + Patterns:
Price has been compressing inside a falling wedge, which statistically resolves to the upside.
The breakout candle broke above the 20 EMA and touched the upper wedge resistance — signaling a decision point.
Volume is rising on bullish candles — initial confirmation of buyer interest, but not yet decisive.
Scenarios to Watch
Bullish Case:
Break and close above $74.20 on higher volume → likely move toward $78–$86 resistance zone.
Confirmation of wedge breakout could trigger trend reversal, aligning with bullish fib levels.
Momentum could accelerate if macro factors support demand (see geopolitics below).
Bearish Case:
Failure to close above $74.20 = fakeout risk → price may reject down to $69.78 or even retest $63.81.
Bearish rejection wick on the daily/4H would be an early signal.
Macro & Geopolitical Factors to Monitor:
Middle East Tensions: Any escalation (especially around Iran or shipping lanes) could spike oil due to supply fears.
US Strategic Reserves & Elections: Moves to refill reserves or control inflation could support demand.
China Demand Recovery: Data showing improved industrial output or stimulus from PBoC may strengthen global oil outlook.
Final Thoughts:
Price is at a pivot zone — breaking this wedge with strength could shift the short-to-midterm trend. Until then, this remains a "show me" breakout . Watch how the next 1–2 weekly candles close around the $74–$75 area to confirm direction.

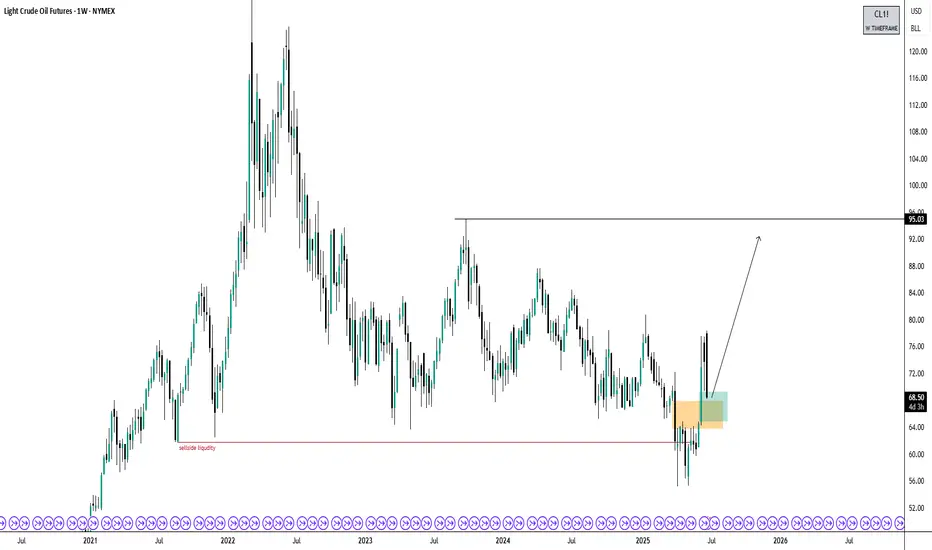
Crude Oil Bullish BiasThree years ago, I predicted that oil would trade below $61 when the price was around $118. Price traded to $55 and is now up to $68. I now believe price has exhausted sell-side liquidity and will trade higher, possibly seeing $95 and beyond.
*Not financial advice
Crude Oil Prices Rocketing amid geopolitical risks
NYMEX:CL1! NYMEX:MCL1! NYMEX:BZ1!
Macro:
Geopolitical tensions remain high and markets are now likely to price in our scenario discussing ongoing air and missile war, given one-off intervention from the US thus far. According to Reuters, the U.S. now assesses that Iranian retaliation could occur within the next two days.What happens next is anybody’s guess but as traders, it is important to navigate these uncertainties with scenario planning and/or reduce risk to account for increased volatility.
We also get Services and Manufacturing PMI data today and PCE Price Index on Friday. Chair Powell is set to testify on Tuesday 9am CT.
Key levels:
Jan 2025 High: 76.57
2025 High: 78.40
2025 CVAH(Composite Value Area High): 75.68
Key LIS zone: 73.50-73.15
We anticipate the following scenarios in crude oil:
Scenario 1:
Prices remain elevated as tensions remain high, despite limited retaliation, however, the situation overall now escalated beyond return to diplomacy.
Scenario 2:
Any push towards de-escalation, unlikely in our analysis, but given the headline risk, crude prices may remain volatile and come off the highs.
Given our key LIS (Line in Sand) zone above, we favor longs above this and shorts below this zone.

Crude Oil Testing $75 Resistance with Key Price Movements Targets:
- T1 = $78.00
- T2 = $80.50
Stop Levels:
- S1 = $74.00
- S2 = $72.50
**Wisdom of Professional Traders:**
This analysis synthesizes insights from thousands of professional traders and market experts, leveraging collective intelligence to identify high-probability trade setups. The wisdom of crowds principle suggests that aggregated market perspectives from experienced professionals often outperform individual forecasts, reducing cognitive biases and highlighting consensus opportunities in Crude Oil.
**Key Insights:**
Crude Oil has been holding strong amid mixed macroeconomic data, with traders noting resilience around the $75 price level acting as a key support. Recent production cuts by OPEC+ have further tightened supply, providing support for bullish sentiment. Dollar weakness also boosts commodity prices, as global markets eye policy decisions from central banks.
Additionally, technical indicators suggest upward momentum is building. RSI levels are nearing overbought zones but remain favorable for a continued upward push. Moving averages show upward crossover patterns, signaling strong bullish possibilities.
**Recent Performance:**
Crude Oil has seen fluctuating performance over the last month, with prices rebounding from lows of $72 and climbing steadily to current levels. A temporary pullback earlier in the week was followed by renewed buying interest, demonstrating the strength of underlying bullish sentiment despite volatile macroeconomic conditions.
**Expert Analysis:**
Industry analysts highlight that geopolitical risks and tightening supply conditions could lead to further upward price pressure. The $75.13 level corresponds to a critical juncture that traders are closely watching for breakouts. A breach above this level would likely signal further upside momentum, potentially reaching the $80 mark as broader optimism prevails.
**News Impact:**
Recent news surrounding OPEC+ production strategies and lower inventories in key storage hubs like Cushing have contributed to bullish sentiment. Simultaneously, macroeconomic factors — including U.S. inflation data and Federal Reserve remarks — are influencing crude oil’s directional moves, albeit in a secondary role.
**Trading Recommendation:**
A bullish position is recommended on Crude Oil as it continues to show potential for a breakout above current resistance levels. Traders should aim for targets of $78.00 and $80.50, using stop-loss orders at $74.00 and $72.50 to mitigate downside risks. Current technical setups and macroeconomic signals support upward momentum, making this a favorable opportunity for disciplined trading.

WTI(oil)For oil, what I have in mind, considering the conditions we are in, if the Strait of Hormuz is not closed, we will remain at the same prices, that is, $75 to $80. But if the Strait is closed 100%, the price will go up to $130 and $150 in the short term.

A barrel at $130? Not unless Hormuz closes for good.As tensions in the Middle East between Iran, Israel and the United States escalate, speculation about a $130 oil barrel resurfaces on the markets. While the recent rise in prices is very real, fuelled by geopolitics, there is nothing in the fundamentals or in the technical analysis to justify such an extreme scenario for the time being. Unless... the Strait of Hormuz is blocked. Here are some explanations.
1) Oil rebounds, but no technical red alert
Since its low point in May, oil prices have surged by over 40%, buoyed by regional tensions and renewed volatility. The market is anticipating a rise in geopolitical risk, but for the time being, this recovery is not being accompanied by any technical red flags.
Indicators such as the COT report (Commitment of Traders), volumes and key technical thresholds on WTI and Brent are not confirming extreme tension at the current stage, as long as US oil remains below resistance at $80 a barrel. Although the 200-day moving average has been breached, and the reintegration of the $65 level has provided the starting point for a bullish impulse, the price of oil is now at a technical crossroads.
The chart below shows a bearish resistance line (red) on WTI, and the same applies to Brent. If these resistances were to be breached, this would be a strong bullish warning signal for the price of a barrel of oil towards $90/95.
2) A market under pressure... but framed by OPEC
Indeed, only a major supply constraint can push oil up to $130 a barrel.
The current geopolitical context comes at the worst possible time for OPEC. The oil cartel, led by Saudi Arabia, had recently decided to increase production after years of restrictions. The objectives were to respond to what was seen as robust demand, win back market share from US producers and punish less disciplined members.
In May, June and July, an increase of 411,000 barrels per day is scheduled. In other words, the market is receiving additional supply, which mechanically limits the risk of a speculative surge, barring a major exogenous shock such as the long-term closure of the Strait of Hormuz.
3) Iran/Israel/USA: the market prices the risk, but doesn't panic. Traders are currently considering three scenarios:
1. Tougher sanctions against Iran, reducing supply by 500,000 to 1 million barrels a day.
2. A targeted attack on Iran's oil infrastructure.
3. A temporary closure of the Strait of Hormuz.
The first two cases can be absorbed by the market, notably thanks to the production capacities of other OPEC+ members or the strategic release of reserves. On the other hand, blocking the Strait of Hormuz would be a “game changer”.
The Strait of Hormuz, between the Persian Gulf and the Gulf of Oman, is the gateway to 20% of the world's oil supply, i.e. some 17 to 18 million barrels a day. It is also a vital route for liquefied natural gas (LNG), particularly from Qatar.
Even a partial shutdown would have an immediate impact on all logistics chains and the energy security of importing countries, and would trigger a brutal price shock. In this case, oil at 130 dollars would no longer be an extreme hypothesis, but a plausible scenario in the very short term.
The situation is, of course, evolving, and investors need to keep an eye out for weak signals: military movements in the Strait, targeted attacks on energy infrastructures, bellicose rhetoric. In the absence of a blockade of Hormuz, the fundamentals (rising OPEC production, slowing Chinese demand, technical stability) militate in favor of a ceiling of around $80/90.
A barrel at $130? Yes, but only if Hormuz closes completely.
DISCLAIMER:
This content is intended for individuals who are familiar with financial markets and instruments and is for information purposes only. The presented idea (including market commentary, market data and observations) is not a work product of any research department of Swissquote or its affiliates. This material is intended to highlight market action and does not constitute investment, legal or tax advice. If you are a retail investor or lack experience in trading complex financial products, it is advisable to seek professional advice from licensed advisor before making any financial decisions.
This content is not intended to manipulate the market or encourage any specific financial behavior.
Swissquote makes no representation or warranty as to the quality, completeness, accuracy, comprehensiveness or non-infringement of such content. The views expressed are those of the consultant and are provided for educational purposes only. Any information provided relating to a product or market should not be construed as recommending an investment strategy or transaction. Past performance is not a guarantee of future results.
Swissquote and its employees and representatives shall in no event be held liable for any damages or losses arising directly or indirectly from decisions made on the basis of this content.
The use of any third-party brands or trademarks is for information only and does not imply endorsement by Swissquote, or that the trademark owner has authorised Swissquote to promote its products or services.
Swissquote is the marketing brand for the activities of Swissquote Bank Ltd (Switzerland) regulated by FINMA, Swissquote Capital Markets Limited regulated by CySEC (Cyprus), Swissquote Bank Europe SA (Luxembourg) regulated by the CSSF, Swissquote Ltd (UK) regulated by the FCA, Swissquote Financial Services (Malta) Ltd regulated by the Malta Financial Services Authority, Swissquote MEA Ltd. (UAE) regulated by the Dubai Financial Services Authority, Swissquote Pte Ltd (Singapore) regulated by the Monetary Authority of Singapore, Swissquote Asia Limited (Hong Kong) licensed by the Hong Kong Securities and Futures Commission (SFC) and Swissquote South Africa (Pty) Ltd supervised by the FSCA.
Products and services of Swissquote are only intended for those permitted to receive them under local law.
All investments carry a degree of risk. The risk of loss in trading or holding financial instruments can be substantial. The value of financial instruments, including but not limited to stocks, bonds, cryptocurrencies, and other assets, can fluctuate both upwards and downwards. There is a significant risk of financial loss when buying, selling, holding, staking, or investing in these instruments. SQBE makes no recommendations regarding any specific investment, transaction, or the use of any particular investment strategy.
CFDs are complex instruments and come with a high risk of losing money rapidly due to leverage. The vast majority of retail client accounts suffer capital losses when trading in CFDs. You should consider whether you understand how CFDs work and whether you can afford to take the high risk of losing your money.
Digital Assets are unregulated in most countries and consumer protection rules may not apply. As highly volatile speculative investments, Digital Assets are not suitable for investors without a high-risk tolerance. Make sure you understand each Digital Asset before you trade.
Cryptocurrencies are not considered legal tender in some jurisdictions and are subject to regulatory uncertainties.
The use of Internet-based systems can involve high risks, including, but not limited to, fraud, cyber-attacks, network and communication failures, as well as identity theft and phishing attacks related to crypto-assets.
