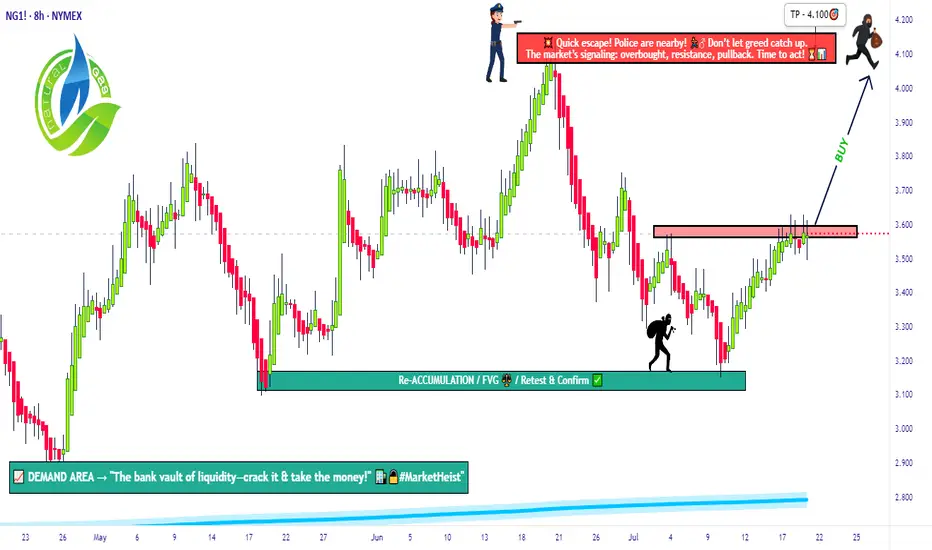
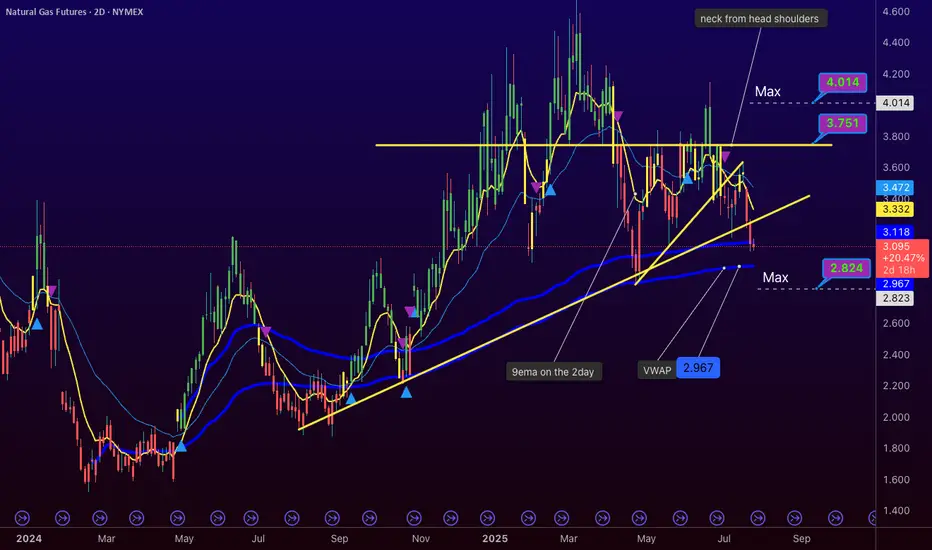
The Great Gas Heist: Load Your Longs Before It Blows💎🚨“Operation Gas Vault: NG1! Breakout Robbery Blueprint”🚨💎
🌟Hi! Hola! Ola! Bonjour! Hallo! Marhaba!🌟
Welcome to all my Market Hustlers & Silent Robbers 🕵️♂️💼💰
Today’s target: NG1! Henry Hub Natural Gas Futures
📍Strategy: A bullish heist mission with a calculated escape plan.
🔥Thief Trading Bluep
Contract highlights
Related commodities
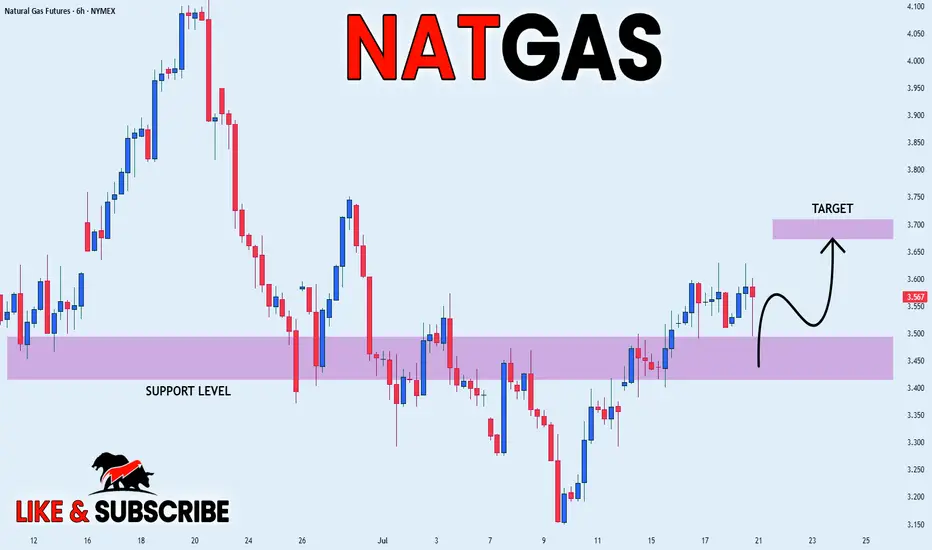
NATGAS REBOUND AHEAD|LONG|
✅NATGAS is going up now
And the price made a bullish
Rebound from the horizontal
Support level around 3.50$
So we are bullish biased and
We will be expecting a
Further bullish move up
LONG🚀
✅Like and subscribe to never miss a new idea!✅
Disclosure: I am part of Trade Nation's Influencer
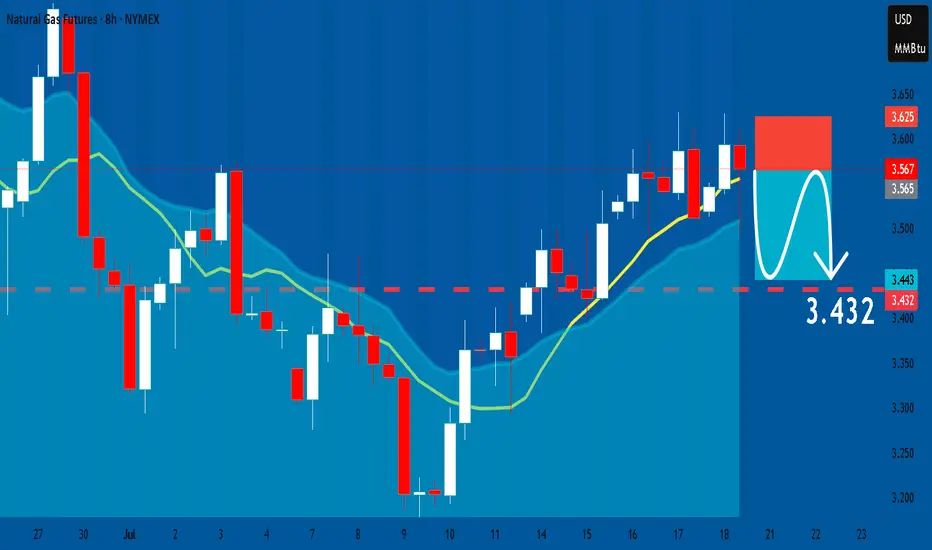
NATGAS: Bearish Continuation & Short Signal
NATGAS
- Classic bearish formation
- Our team expects fall
SUGGESTED TRADE:
Swing Trade
Sell NATGAS
Entry Level - 3.567
Sl - 3.625
Tp - 3.432
Our Risk - 1%
Start protection of your profits from lower levels
Disclosure: I am part of Trade Nation's Influencer program and receive a monthly
Natural Gas Futures Signal Breakdown Below Mid-Band Support
The most recent candle closed below the middle Bollinger Band (20 SMA), indicating potential downside momentum.
The price recently spiked toward the upper band (~$4.20) but was strongly rejected, creating a bearish reversal pattern.
Volume has been increasing on down days, especially the last fe

NATGAS Trading Opportunity! SELL!
My dear followers,
This is my opinion on the NATGAS next move:
The asset is approaching an important pivot point 3.567
Bias - Bearish
Technical Indicators: Supper Trend generates a clear short signal while Pivot Point HL is currently determining the overall Bearish trend of the market.
Goal
Natural Gas | Oil | Dollar | Silver | Gold Price Forecast.Natural Gas | Oil | Dollar | Silver | Gold Price Forecast.
NYMEX:NG1! AMEX:UNG NYMEX:CL1! COMEX:GC1!

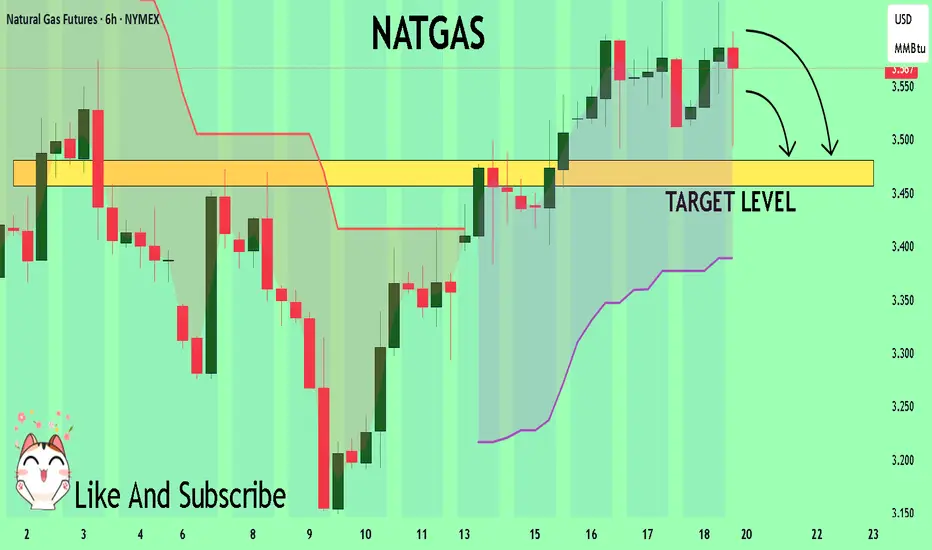
NATGAS Support Ahead! Buy!
Hello,Traders!
NATGAS keeps falling but
A strong horizontal support
Level is ahead at 3.00$ so
After Gas retests the support
We will be expecting a local
Bullish rebound
Buy!
Comment and subscribe to help us grow!
Check out other forecasts below too!
Disclosure: I am part of Trade Natio

Natural Gas Slips Below Support – More Downside Ahead ?
Recent candles are large-bodied bearish candles, indicating strong selling pressure.
Bollinger Basis is sloping downward, showing short-term bearish momentum.
Price is currently below both the 20-day and 50-day moving averages, reinforcing the bearish outlook.

NG1!: Target Is Up! Long!
My dear friends,
Today we will analyse NG1! together☺️
The price is near a wide key level
and the pair is approaching a significant decision level of 3.087 Therefore, a strong bullish reaction here could determine the next move up.We will watch for a confirmation candle, and then target the n

NG1! Bearish Break to $3.00-$2.82 by Tuesday?www.tradingview.com NYMEX:NG1! Update - Bears Pushing, Turnaround Looms Short-Term Odds: ~60% pullback to $3.00-$2.99, ~40% chance to $2.82 - Key Signal: Low volume on 1000-tick chart, holding below VWAP ($3.134). Third test at $3.10 done—$3.00 next if support breaks. - Trend Hint: Bearish with hig
See all ideas
Summarizing what the indicators are suggesting.
Neutral
SellBuy
Strong sellStrong buy
Strong sellSellNeutralBuyStrong buy
Neutral
SellBuy
Strong sellStrong buy
Strong sellSellNeutralBuyStrong buy
Neutral
SellBuy
Strong sellStrong buy
Strong sellSellNeutralBuyStrong buy
A representation of what an asset is worth today and what the market thinks it will be worth in the future.
Displays a symbol's price movements over previous years to identify recurring trends.
Frequently Asked Questions
The current price of E-mini Natural Gas Futures (Nov 2026) is 4.225 USD / MMBTU — it has fallen −0.82% in the past 24 hours. Watch E-mini Natural Gas Futures (Nov 2026) price in more detail on the chart.
Track more important stats on the E-mini Natural Gas Futures (Nov 2026) chart.
The nearest expiration date for E-mini Natural Gas Futures (Nov 2026) is Oct 27, 2026.
Traders prefer to sell futures contracts when they've already made money on the investment, but still have plenty of time left before the expiration date. Thus, many consider it a good option to sell E-mini Natural Gas Futures (Nov 2026) before Oct 27, 2026.
Open interest is the number of contracts held by traders in active positions — they're not closed or expired. For E-mini Natural Gas Futures (Nov 2026) this number is 9.00. You can use it to track a prevailing market trend and adjust your own strategy: declining open interest for E-mini Natural Gas Futures (Nov 2026) shows that traders are closing their positions, which means a weakening trend.
Buying or selling futures contracts depends on many factors: season, underlying commodity, your own trading strategy. So mostly it's up to you, but if you look for some certain calculations to take into account, you can study technical analysis for E-mini Natural Gas Futures (Nov 2026). Today its technical rating is sell, but remember that market conditions change all the time, so it's always crucial to do your own research. See more of E-mini Natural Gas Futures (Nov 2026) technicals for a more comprehensive analysis.