QMH2026 trade ideas

What Is the Base Price for Oil?What is the base price for oil? Specifically, today we will discuss crude oil, and we can apply this understanding to other commodities as well.
I won't go into too much technical detail about the difference between the base price and the cost price for crude oil, but for most people, it helps to see the title as “Is there a bottom-line price or support level for crude oil?”
My answer is yes, and this is due to inflation. Over time, we tend to pay higher prices for food, gas and many others that we consume.
WTI Crude Oil Futures & Options
Ticker: MCL
Minimum fluctuation:
0.01 per barrel = $1.00
Disclaimer:
• What presented here is not a recommendation, please consult your licensed broker.
• Our mission is to create lateral thinking skills for every investor and trader, knowing when to take a calculated risk with market uncertainty and a bolder risk when opportunity arises.
CME Real-time Market Data help identify trading set-ups in real-time and express my market views. If you have futures in your trading portfolio, you can check out on CME Group data plans available that suit your trading needs www.tradingview.com
Trading the Micro: www.cmegroup.com
www.cmegroup.com

Why Oil Stays Bullish: Israel-Iran and the APMMCurrent geopolitical tensions between Israel and Iran have precipitated significant volatility in global oil markets. This study analyzes the immediate and medium-term impacts of the conflict on oil prices utilizing the Advanced Petroleum Market Model (APMM), a multifactorial fundamental analysis framework. The analysis reveals that both robust supply fundamentals and geopolitical risk premiums are currently supporting oil prices at elevated levels.
1. Introduction
Global energy markets are experiencing upward pressure from escalating tensions between Israel and Iran. Israeli military actions against Iranian targets have triggered immediate oil price responses, with Brent crude rising up to 10% and reaching the highest levels since January 2024 (Al Jazeera, 2024). The Strait of Hormuz, through which approximately 20% of global oil trade flows, remains central to geopolitical risk pricing in oil markets (CNBC, 2024).
2. Current APMM Market Assessment
The Advanced Petroleum Market Model currently indicates a Bullish (Weak) regime with a composite score of 69.1 and a rising trend. Supply indicators are bullish, inventory and demand are neutral. The model's adaptive status shows it is successfully adjusting to current market conditions.
3. Market and Model-Based Scenario Analysis
- Brent Crude: 5-7% increase to over $87/barrel
- WTI Crude: 6% daily gain
- Geopolitical Risk Premium: $8-12/barrel (Goldman Sachs, 2024)
The APMM's current reading suggests oil markets are in a "Fundamental Support Regime" reinforced by geopolitical risk premiums. Geopolitical uncertainty is inherently bullish for oil prices as it increases supply disruption risks and drives precautionary demand.
Scenario Probabilities
- Base Scenario (65%): Bullish (Weak) regime persists, prices stabilize at $75-85/barrel
- Escalation (25%): Strong Bullish regime, prices at $85-95/barrel
- Extreme (10%): Extreme Bullish regime, prices above $100/barrel
4. Long-term and Policy Implications
- Diversification: Importers seek alternatives to Middle Eastern oil
- Strategic Reserves: Governments reconsider reserve strategies
- Energy Transition: Geopolitical risks strengthen investments in renewables
5. Conclusion
Despite robust supply, oil prices are supported by both fundamentals and persistent geopolitical risk premiums. The APMM reflects this environment with a Bullish (Weak) signal and rising trend. Geopolitical uncertainty remains a key bullish factor for oil markets.
References
Al Jazeera. (2024). Oil prices spike as Israel strikes Iran amid Middle East tensions.
Armstrong Economics. (2024). Oil Prices & the Israel-Iran Crisis - A Historical Perspective.
BBC. (2024). Israel Iran: What could conflict mean for oil and gas prices?
Chen, S., Liu, P., & Wang, J. (2024). Uncertainty about interest rates and crude oil prices. Financial Innovation, 10(1), 1-28.
CNBC. (2024). Oil prices could spike to $95 if Iran-Israel conflict escalates, Goldman Sachs warns.
Goldman Sachs. (2024). Commodities Research: Middle East Risk Premium in Oil Markets.
Al-Shboul, M., & Alqaralleh, H. (2025). Dynamic Effects of Economic Uncertainties and Geopolitical Risks on Saudi Stock Market Returns. Journal of Risk and Financial Management, 18(1), 12.

Crude oil----Buy around 71.00-72.00, target 73.00-77.00Crude oil market analysis:
Last week's crude oil was very exaggerated because it broke the super suppression of 65.00 on the daily line. Once this position was broken, crude oil began to be standard. This is also the result of our many predictions of the cycle. Crude oil purchases will continue to soar this week. In addition, the escalation of the situation in the Middle East will make it difficult for crude oil to fall in the short term. I estimate that there is a possibility of repair. The retracement during the repair is our opportunity to buy again. In addition, the delivery period of crude oil futures contracts will also cause it to fluctuate violently again.
Fundamental analysis:
There are many fundamental analyses and data recently. Geopolitical factors are the main reason for its violent fluctuations. In addition, there is a holiday in the United States this week, and there is also a Federal Reserve interest rate result.
Operation suggestions:
Crude oil----Buy around 71.00-72.00, target 73.00-77.00

Geopolitics (Iran/Israel), 6 relevant risk barometersGeopolitics is in the spotlight this week, along with the FED's monetary policy decision. Geopolitical news is covered by the general media, so there's no need here to repeat information that's accessible to everyone. We therefore propose to review our selection of stock market barometers which, in our opinion, best measure the intensity of geopolitical risk.
1) Oil and natural gas prices
Naturally, oil price trends are the main barometer of the geopolitical risk of the current confrontation between Israel and Iran. Although Iran accounts for just 3% of the world's oil supply, the region itself represents 20%, and above all there is a risk of closure of the Strait of Hormuz, through which 25% of the world's oil supply passes. Technical analysis of the oil price is therefore the primary tool for measuring the intensity of current geopolitical tensions. The price of oil recently returned to the former technical support of $65, but there is no major bullish technical signal as long as the price of US crude oil remains below resistance at $80. We must therefore keep a close eye on the $80 threshold for US oil.
2) The trend of the S&P 500 index, the benchmark of Western finance
The equity market is the second barometer of geopolitical risk that we offer. The most important thing is to select the stock indices that best represent the perception of geopolitical tensions. We believe that the S&P 500 future contract does this job well, as it is the most widely traded stock market futures index in terms of volume by global high finance.
A few days ago, we published a detailed graphical analysis of the S&P500 index, which you can consult by clicking on the image below.
3) Trends on the main stock markets in the Near and Middle East
Equity markets in the Near and Middle East are excellent indicators of the current perception of geopolitical tensions between Iran and Israel. We suggest you take a look at the Saudi Arabian Stock Exchange (Tadawul), the region's largest in terms of market capitalization. Naturally, you should also follow the trend of the Tel Aviv Stock Exchange's flagship index, the TA 35, as well as that of the Egyptian stock market. These markets have the advantage of being open on Sundays, and are often a good early indicator of trends in Asia and Europe for Monday morning.
4) The trend of the US dollar (DXY) on the foreign exchange market (Forex) and of gold on the commodities market
On the floating foreign exchange market (FX), it is the US dollar that plays to the full its safe-haven aspect. In the event of geopolitical tensions spiraling out of control, it would make a strong bullish reversal. This week, however, the US dollar will be under the influence of the FED.
So it's best to trust gold's trend as a barometer of geopolitical risk. Geopolitics is not necessarily the dominant fundamental factor, but rather the dynamics of interest rates and the US dollar.
5) The TRUFLATION trend
If current geopolitical tensions were to become a major global shock, international trade would be disrupted, and transport difficulties would lead to a sharp rise in prices, particularly for raw materials and industrial goods. This potential price rise would then be rapidly reflected in TRUFLATION, the benchmark for real-time price dynamics in the USA.
DISCLAIMER:
This content is intended for individuals who are familiar with financial markets and instruments and is for information purposes only. The presented idea (including market commentary, market data and observations) is not a work product of any research department of Swissquote or its affiliates. This material is intended to highlight market action and does not constitute investment, legal or tax advice. If you are a retail investor or lack experience in trading complex financial products, it is advisable to seek professional advice from licensed advisor before making any financial decisions.
This content is not intended to manipulate the market or encourage any specific financial behavior.
Swissquote makes no representation or warranty as to the quality, completeness, accuracy, comprehensiveness or non-infringement of such content. The views expressed are those of the consultant and are provided for educational purposes only. Any information provided relating to a product or market should not be construed as recommending an investment strategy or transaction. Past performance is not a guarantee of future results.
Swissquote and its employees and representatives shall in no event be held liable for any damages or losses arising directly or indirectly from decisions made on the basis of this content.
The use of any third-party brands or trademarks is for information only and does not imply endorsement by Swissquote, or that the trademark owner has authorised Swissquote to promote its products or services.
Swissquote is the marketing brand for the activities of Swissquote Bank Ltd (Switzerland) regulated by FINMA, Swissquote Capital Markets Limited regulated by CySEC (Cyprus), Swissquote Bank Europe SA (Luxembourg) regulated by the CSSF, Swissquote Ltd (UK) regulated by the FCA, Swissquote Financial Services (Malta) Ltd regulated by the Malta Financial Services Authority, Swissquote MEA Ltd. (UAE) regulated by the Dubai Financial Services Authority, Swissquote Pte Ltd (Singapore) regulated by the Monetary Authority of Singapore, Swissquote Asia Limited (Hong Kong) licensed by the Hong Kong Securities and Futures Commission (SFC) and Swissquote South Africa (Pty) Ltd supervised by the FSCA.
Products and services of Swissquote are only intended for those permitted to receive them under local law.
All investments carry a degree of risk. The risk of loss in trading or holding financial instruments can be substantial. The value of financial instruments, including but not limited to stocks, bonds, cryptocurrencies, and other assets, can fluctuate both upwards and downwards. There is a significant risk of financial loss when buying, selling, holding, staking, or investing in these instruments. SQBE makes no recommendations regarding any specific investment, transaction, or the use of any particular investment strategy.
CFDs are complex instruments and come with a high risk of losing money rapidly due to leverage. The vast majority of retail client accounts suffer capital losses when trading in CFDs. You should consider whether you understand how CFDs work and whether you can afford to take the high risk of losing your money.
Digital Assets are unregulated in most countries and consumer protection rules may not apply. As highly volatile speculative investments, Digital Assets are not suitable for investors without a high-risk tolerance. Make sure you understand each Digital Asset before you trade.
Cryptocurrencies are not considered legal tender in some jurisdictions and are subject to regulatory uncertainties.
The use of Internet-based systems can involve high risks, including, but not limited to, fraud, cyber-attacks, network and communication failures, as well as identity theft and phishing attacks related to crypto-assets.

Crude oil---Buy near 72.00, target 72.90-74.90Oil market analysis:
Recently, the daily crude oil line has started to pull up, and buying has begun to rise. The retracement is our opportunity to buy again. The moving average support of the daily crude oil line has begun to move up, and the pattern has reached around 69.60. Today's idea is to buy at 72.00. The pattern is difficult to see, just buy repeatedly. The fight between Iran and Israel is a great support for crude oil. In addition, there is EIA crude oil inventory data today.
Fundamental analysis:
Previously, we have been paying attention to geopolitical factors in the fundamentals. Indeed, the situation in the Middle East has also changed the way of gold and crude oil. Today we focus on the monetary policy of the Federal Reserve, and Chairman Powell's speech during the US trading time.
Operational suggestions:
Crude oil---Buy near 72.00, target 72.90-74.90

Geopolitical Oil Shocks May Be Short-Lived and Prices May Fall
Crude oil prices are climbing by over 1% today across both Brent and West Texas Intermediate, approaching their highest levels since January.
These gains are driven by rising concerns over the fallout from a potential escalation in the Israel–Iran war, especially with the prospect of direct U.S. military involvement that could widen the conflict and threaten oil supplies from the Middle East.
Talks are intensifying around a possible U.S. strategic bomber strike on Iran’s Fordow uranium enrichment facility. Such a move would mark a dangerous new phase of escalation, raising the risk of supply disruptions from key oil-exporting countries via the Strait of Hormuz or the Bab el-Mandeb Strait, according to several analysts and opinion columnists . Iran’s major oil export facilities may also be pulled into the conflict sooner rather than later.
Any attack on these energy assets could trigger a price shock that sends oil soaring toward $130 per barrel, according to estimates from JPMorgan .
The first step toward this new phase of escalation may not be far off, as former President Trump appears unshaken by potential consequences—the include regional instability to possible retaliatory attacks on U.S. and allied interests abroad. According to Axios , he is doubtful about the effectiveness of the bunker-busting bombs intended for a Fordow strike.
Even without such a strike, a prolonged conflict with little hope for a diplomatic resolution would likely increase the vulnerability of global oil flows, as reported by the Wall Street Journal earlier this week. However, such disruptions are expected to remain short-term, in my opinion.
In the longer run, this war is unlikely to be sustainable in its current form. Israel is reportedly facing a dwindling supply of interceptor missiles, with reserves potentially lasting just 12 more days at the current rate of Iranian rocket fire, according to experts cited by The Washington Post . The Journal also quoted a U.S. official who mentioned a decline in Israel’s supply of Arrow missiles used to intercept ballistic threats.
In my view, Israel will likely avoid reaching such a tipping point unless it achieves a decisive turning point in the conflict, whether through sidelining U.S. involvement or toppling Iran’s regime. If neither is achieved, Israel may resort to targeting Iran’s oil and gas export infrastructure to enforce a surrender. This action that could send oil prices into shock in the coming days. A drawn-out war in its current form is unsustainable for either side.
Still, a diplomatic solution is not entirely off the table. A senior Iranian foreign ministry official told the New York Times that Tehran may accept Trump’s offer to meet soon for a potential ceasefire discussion. Such developments could reduce the geopolitical risk premium priced into oil and potentially push U.S. crude back below $70 per barrel.
In any case, I believe any shock to oil prices would likely be temporary, as major producers are generally capable of offsetting short-term supply disruptions unless we enter into extreme scenarios, as noted by the Wall Street Journal’s Editorial Board earlier this week.
On another front, oil prices are also under increasing pressure from concerns around prolonged monetary tightening by the Federal Reserve. Jerome Powell’s speech yesterday disappointed markets, striking a more hawkish and cautious tone than before on interest rate cuts.
Policymakers have grown increasingly wary of inflation risks, particularly with the renewed trade war and rising geopolitical tensions, which could potentially push inflation above 3 percent again.
Such extended tightening could weigh further on economic growth or even trigger a recession, dragging down oil demand and keeping prices on a downward trajectory.
Monetary tightening risks also overlap with persistent negative signals from China. Despite improvements in retail sales and declining unemployment, both industrial production and fixed-asset investment slowed unexpectedly in May. Goldman Sachs also expects continued weakness in China’s housing market, which could remain at just a quarter of its 2017 peak level for years to come.
Should trade negotiations between the U.S. and China fail, both economies and oil prices could face further downward pressure.
Samer Hasn

WTI(20250618)Today's AnalysisMarket news:
World Gold Council: 95% of central banks expect gold reserves to rise in the next 12 months.
Technical analysis:
Today's buying and selling boundaries:
72.29
Support and resistance levels:
76.53
74.95
73.92
70.66
69.63
68.04
Trading strategy:
If the price breaks through 73.92, consider buying, the first target price is 74.95
If the price breaks through 72.29, consider selling, the first target price is 70.66

Crude Oil - Cup and HandlePotential Cup and Handle
I have a trigger upper the top .. potential short before the new long wave
Actual we can have completed the 3 of 5.

Chasing Oil Spikes? How Geopolitics Can Wreck SetupsOil prices surged over 12% in Asia on Middle East headlines, sparking a surge of volatility across safe-haven currencies and stock market futures during thin trade.
It felt like a good time to provide food for thought to newer traders looking to chase these moves, highlight the mockery geopolitics can make of technical analysis with recent examples, and provide a filter for when the waters may be safer to reenter.
Matt Simpson, Market Analyst at City Index and Forex.com

Oil | Long | Smart Money Accumulation | (June 2025)Oil | Long | Geopolitical Conflict & Smart Money Accumulation | (June 2025)
1️⃣ Short Insight Summary:
We're watching a long-term bullish setup in crude oil, driven by rising geopolitical tensions, smart money accumulation, and a potential reclaim of key levels from a historic triangle pattern.
2️⃣ Trade Parameters:
Bias: LongEntry: Watching for a reclaim of the $72 level (re-entry into triangle zone)Stop Loss: $62 (just below the recent liquidation zone)
TP1: $106
TP2: $116
TP3: $123
3️⃣ Key Notes:
This setup originates from a macro triangle structure formed since September 2012. Oil broke out post-2020 and surged, but recent volatility has shaken out many long positions—especially those from around $60.8. A reclaim of $72 would indicate a failed auction and potential continuation higher.
Geopolitical instability—particularly in the Middle East—continues to provide bullish tailwinds. JPMorgan has projected potential upside targets as high as $230 if tensions escalate.
The Volatility Index (VIX) is around 19, suggesting a calm market—often a precursor to strong directional moves. Smart money seems to be stepping in, accumulating positions during dips.
✅ This confluence makes oil a compelling candidate for macro upside, especially if global uncertainty deepens.
4️⃣ Optional Follow-up Note:
If the setup confirms, I’ll update this idea with revised targets and entry levels. Keep an eye on geopolitical developments—they’ll be key triggers.
Please LIKE 👍, FOLLOW ✅, SHARE 🙌 and COMMENT ✍ if you enjoy this idea! Also share your ideas and charts in the comments section below! This is best way to keep it relevant, support us, keep the content here free and allow the idea to reach as many people as possible.
Disclaimer: This is not a financial advise. Always conduct your own research. This content may include enhancements made using AI.

WADZ & the Petrodollar RevivalGlobal FX Shift: The Rise of WADZ (2025–2026)
In mid-2025, a war between Iran and Israel spirals fast. Iran strikes hard, Israel’s defenses go offline from cyberattacks, and the U.S. surprisingly doesn’t intervene.
Instead, America steps in quietly, setting up a “peacekeeping” zone along the Jordan-Israel border. It’s called the West Asia Demilitarized Zone (WADZ) — but behind the scenes, it’s about control, not peace.
Oil jumps to $115.
Markets flip. USD/JPY and USD/TRY spike. EUR/USD slides.
Then the U.S. launches WZ-Digital, a USD-backed oil coin. Now, all oil in the region trades through America.
OPEC fractures. Saudi and UAE fall in line.
China gets iced out. USD/CNY shoots past 8.30.
In the desert, a secret U.S. city appears: The Watchtower — a hub that manages oil, data, and borders.
Regional FX Snapshot (2026)
Europe: Gas crisis deepens. EUR/USD drops to 0.95. East Europe leans on U.S.
China: Crypto-oil push fails. Capital flight triggers USD/CNY → 8.80.
Russia: Oil-for-yuan helps short-term, but ruble stays shaky.
Africa: Egypt & Morocco adopt WZ-Digital. Local currencies stay weak.
Southeast Asia: Dual oil trade (USD/WZ). SGD steady, MYR & IDR choppy.
(BRICKS+)
Latin America: Brazil, Argentina resist — then cave. USD demand surges.
Bottom Line:
By end of 2026, USD isn’t just money — it’s a global system.
WADZ quietly reprograms the rules of energy and trade.
No invasion, no headlines. Just quiet, total control.
Bye guys

CL1! barking bearish trend. As observed in the weekly time frame, CL1 has broken a bearish trend that emerged after June 2022. Currently, CL1 exhibits bullish sentiment, and based on global news, it is likely to continue its upward trajectory.

The Hidden Power of Median Price: A Recent Oil Market Case StudyIntroduction
In the world of trading, most market participants focus on popular patterns and oscillators, often missing the true “magnet” zones that drive price action. A recent move in Crude Oil (CL) perfectly illustrates how the prior year’s median price (PYM) can act as a powerful, objective key level—one that offers traders an informational edge when recognized and used properly.
Case Study: Oil’s Rally to the Prior Year Median
What Happened?
• Catalyst: Crude Oil (CL) surged several dollars overnight due to escalating geopolitical tensions and the risk of war in the Middle East.
• Key Level Test: Instead of stalling at arbitrary points, price rallied directly to the prior year’s median price—a level rarely plotted by standard indicators.
• Market Reaction: Upon reaching this PYM, oil rejected sharply not once, but twice in consecutive sessions, creating what many would recognize as a double top.
• Missed Context: While most traders saw only the double top pattern, those aware of the PYM understood the deeper reason for this reversal, adding conviction to their trade ideas.
Why the Median Price Matters
• Objective Anchor: The median price of the prior year is a statistically robust, non-arbitrary level that reflects the “center of gravity” for a full year’s worth of price action.
• Institutional Awareness: Professionals and trading algorithms often use these levels as reference points for liquidity and mean reversion, even if retail traders overlook them.
• Trade Conviction: When a double top or reversal forms at a prior year’s median price, it transforms a generic pattern into a high-conviction setup, providing a clear, data-driven reason for price to reverse or stall.
Data Snapshot: CL Price Action (June 2025)
Date High Low Close Event/Reaction
June 12, 2025 $77.52 $69.50 $73.96 Sharp rally to PYM, first rejection
June 14, 2025 $74.02 $71.48 $72.98 Second push, another rejection
June 15, 2025 $74.22 $73.19 $73.69 Double top confirmed
The $74–$77 area aligns with the 2024 median/average price for WTI crude oil, reinforcing its significance as a magnet and reversal zone.
Lessons for Traders
• Beyond Oscillators: Oscillators and generic chart patterns often lack context and can lead to false signals. Key levels like the median price explain why price reverses, not just where patterns form.
• Edge Through Awareness: Plotting prior year medians and other session-based key levels can turn ordinary setups into high-probability trades by revealing hidden order flow and institutional logic.
• Professional Mindset: Treating these levels as “market memory” aligns your approach with how professionals view the market, offering a real edge over retail-centric tools.
Conclusion
The recent oil rally and rejection at the prior year’s median price is a compelling demonstration of the power of objective, price-based key levels. While most traders saw only a double top, those aware of the PYM had a clear, data-driven reason for heightened conviction and precise execution. Incorporating such levels into your trading toolkit can provide a true informational edge—one that most indicator vendors and platforms still ignore.
Ready to take your trading to the next level? Start plotting median price levels and see the difference for yourself!

#202524 - priceactiontds - weekly update - wti crude oil futuresGood Day and I hope you are well.
comment: Good week for oil bulls but still a lower high below the April high 78.1. Now what? If this buying is the real thing and market is expecting higher prices for longer, the pullback will stay above 70. If bulls do that, we can expect at least a second leg up to retest 75+ or even 80+. We are seeing a full on war between Israel and Iran but you should not trade based on that. There are bulls who bought above 73 on Friday and lost Money so far.
current market cycle: trading range 54 - 78 on the weekly tf. Decent chance we are in a bull trend that could lead to 80/84 or higher.
key levels: 70 - 77
bull case: Bulls have all the arguments on their side. They now need to leave a big open gap to 69.3 and then we can do a measured move up. My lowest target for that is 80. Structure on the 1h chart is a textbook two-legged pullback and above 74.5 it’s a clear buy signal.
Invalidation is below 70.8 but can likely also be 70
bear case: Bears do not have much. They trapped late bulls on Friday and that’s a likely reason we sold off 677 ticks from the high. They need lower lows below 70.8 and close the gap to the Thursday high before the news-bomb hit. For that to happen they have to break 2 bull trend lines. I will not look for shorts on this tbh.
Invalidation is above 74.5
short term: Bullish. Maybe a bit more sideways but I have given two invalidation prices for bulls and couple of targets above. I don’t think looking for shorts makes any sense unless you are really good at scalping.
medium-long term - Update from 2025-06-15: Maybe we have seen the 2-year trading range coming to an end on Friday and we are in a new bull trend that could lead oil to 80 or higher. Right now it’s pure guesswork until we print higher highs above Friday’s 77.62. Oil above 80 is not something we have seen since end of 2023 so expect some ripples.

crude oil on good pattern formation crude oil on good pattern formation , entry with minor sl can deliver good R:R
(6100-6200) can be a good stand for near term

Crude Oil Going Higher - TA and fundamentals aligneThe 0-5 count is not over yet.
Sudo 4 and 5 are still lurking.
It's good to see how the Medianline-Set cought the Highs of the swings. Likewise we can see the subborn rejection at the Center-Line at P3.
I will not trade CL to the short side, until it's clear that P4 is engraved in this Chart. Until then, I maybe shoot for some intraday or dayli trades in Crude.
Economy Facts that support a rise, up to P4:
Crude oil refineries typically switch to producing more gasoline (fuel for cars) in the spring, particularly around March to April in the United States and other northern hemisphere countries.
Seasonal demand: Warmer months mean more driving and vacation travel, increasing gasoline demand.
Regulatory change: Refineries begin producing summer-grade gasoline, which has lower volatility and is required by environmental regulations (especially in the U.S. under EPA rules).
The switch to summer-grade gasoline must be completed by June 1st for retail and May 1st for terminals and pipelines in the U.S.
In Summary:
- Switch begins: March–April
- Completed by: May (terminals), June (retail)
- This seasonal shift is often called the "refinery maintenance season" or "spring blend switch."

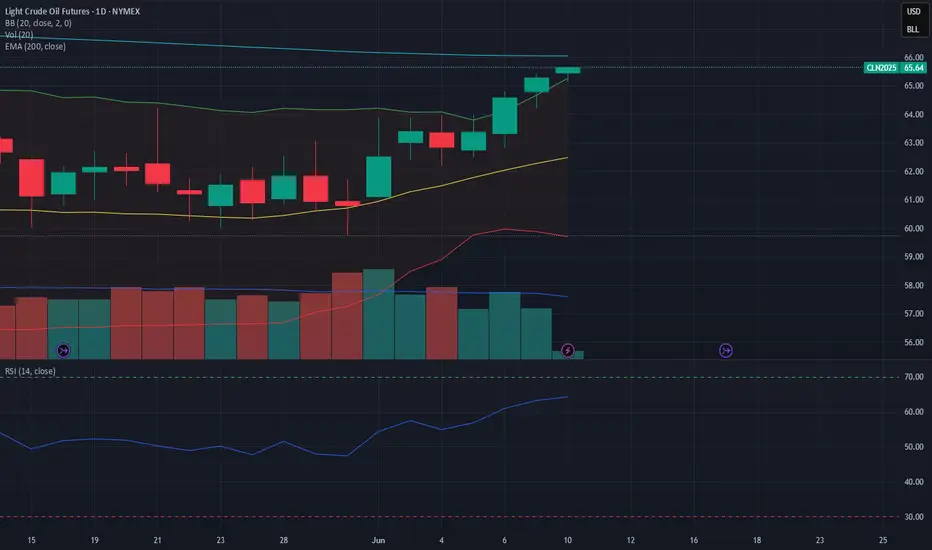
Will there be a big rise in oil prices? WTI crude futures rose to around $66.1 per barrel on Tuesday, continuing gains for the second consecutive session, as ongoing geopolitical tensions fuel concerns about a possible reduction in global supply.
Russia and Ukraine held a second round of direct peace talks after the sharp escalation of hostilities the previous day, but the discussions failed to produce any significant progress in resolving the three-year conflict.
Further intensifying supply concerns, a wildfire in Alberta, Canada, forced a temporary halt to oil and gas production. Meanwhile, OPEC+ kept its July production increase at the same level as the previous two months, easing fears of a supply surge.
In addition, an Iranian diplomat said on Monday that Iran is ready to reject the US proposal to resolve the decade-long nuclear dispute, saying it does not meet Tehran's interests or change Washington's position on uranium enrichment.
A fire in Alberta, Canada, caused a temporary disruption in oil and gas production, raising further concerns about supply. Meanwhile, OPEC+ decided to keep its July production increase at the same level as in the previous two months, easing concerns about oversupply.
Last week, OPEC+ decided to increase its combined production by an additional 411,000 barrels per day. The decision was made following expectations of a more significant increase that had affected energy stocks ahead of the group's latest meeting.
The increase was less than expected, which had a positive impact on prices, which continue to rise.
For investors in the oil sector, the worst fear is a possible repeat of a price war like the one in 2020, which led to a drastic collapse in oil prices.
This scenario is unlikely, as the US cannot afford an oil price below $50. In fact, $50 represents the break-even point for the oil sector. This situation is leading the US and Saudi Arabia towards a more cautious approach, which is why the expected significant increase in oil production did not occur last week.
A further positive sign for oil prices emerges from the analysis of the futures curve, which is currently in backwardation. Backwardation is a condition in which forward prices are lower than the current spot price, resulting in a downward slope of the forward curve. As the contract expiry date approaches, the differential between the spot price and the forward price tends to narrow, causing the curve to converge back towards the spot price.
The conditions of the futures markets are:
Normal market (contango): balanced supply and demand.
Weak demand and excess supply: amplification of contango.
Excess demand: reduction in contango to backwardation, where the difference between the near and far prices can theoretically increase indefinitely.
The recent rises, supported by above-average volumes, indicate that only exceeding the 200-period moving average could trigger a strong long trend with a target of $70 per barrel.
Recent geopolitical tensions suggest the possibility of a bullish move on oil. Iran has increased its stockpiles of enriched uranium to near weapons-grade levels in recent months, raising further doubts about the possibility of reaching an agreement with the US on Tehran's nuclear program.
Sanctions and restrictions on global oil supply will favor an increase in prices. Tensions between Russia and Ukraine continue, with mutual attacks instead of negotiations. We expect oil prices to be around $70 in the next quarter.
Weekly Market Forecast: BUY Stock Indices & Oil! Sell Gold! In this Weekly Market Forecast, we will analyze the S&P 500, NASDAQ, DOW JONES, Gold and Silver futures, for the week of June 9 - 13th.
Stock Indices are looking more bullish. Valid buys only!
Gold is weak. Sells only until there is a market structure shift upwards.
Oil prices have room to go higher. Buy it.
Silver is a wait and see. Should start to pull back this week, as it closed last week stronger than Gold.
CPI Wednesday. After the news is announced, the market should be very tradeable for the rest of the week.
Enjoy!
May profits be upon you.
Leave any questions or comments in the comment section.
I appreciate any feedback from my viewers!
Like and/or subscribe if you want more accurate analysis.
Thank you so much!
Disclaimer:
I do not provide personal investment advice and I am not a qualified licensed investment advisor.
All information found here, including any ideas, opinions, views, predictions, forecasts, commentaries, suggestions, expressed or implied herein, are for informational, entertainment or educational purposes only and should not be construed as personal investment advice. While the information provided is believed to be accurate, it may include errors or inaccuracies.
I will not and cannot be held liable for any actions you take as a result of anything you read here.
Conduct your own due diligence, or consult a licensed financial advisor or broker before making any and all investment decisions. Any investments, trades, speculations, or decisions made on the basis of any information found on this channel, expressed or implied herein, are committed at your own risk, financial or otherwise.

CL - Crude Oil - long strategyCL - Crude Oil - long strategy
RSI confirmed potential new long opportunities
H&S reversal pattern
There are conditions for inversion

Crude Oil Triangle Breakout Near – Watch 5600 Zone Closely!🛢 CRUDEOIL – Weekly Outlook (4H Timeframe)
Published by: Shalvi Sharma (Power Commodity Trading)
Crude is trading around 5568 and approaching a crucial triangle breakout zone.
⚠️ Key Levels:
Breakout Resistance: 5600 – 5675
Bearish OB Zone: 5675 – 5800
Immediate Support: 5374 (EMA55)
Demand Zone: 5180 – 5270
🔍 Technical Outlook:
Price is compressing within a symmetrical triangle formation.
A breakout above 5600 with volume confirmation could push price towards the 5800 zone.
However, Bearish Order Block (OB) awaits near 5800 — this zone has historically rejected upside moves.
🎯 Possible Scenarios:
Bullish: Break & hold above 5600 → Upside targets: 5675 → 5740 → 5800
Bearish: Rejection at 5600 – 5675 → Downside pullback possible towards 5400 – 5374
📌 Wait for confirmation — breakout with volume will be the key driver.
Stay nimble and trade with defined risk.
#CrudeOil #MCXCrude #PowerOfCommodity #TriangleBreakout #TradingViewIndia #EnergyMarkets #TechnicalAnalysis
Comment below if you think it's bearish?

Oil Rebounds to $59 as US Inventories Drop – Reversal Ahead?After recent declines, crude oil futures (CL1!) staged a modest recovery during Thursday’s session, trading near $59.10 per barrel. The rebound comes as US crude inventories unexpectedly dropped, easing concerns about oversupply and providing a short-term lift to prices.
Key Drivers Behind the Rebound
US Inventory Drawdown – The latest EIA report showed a decline in crude stockpiles, signaling stronger demand and helping prices stabilize.
Technical Support Holds Firm – The bounce aligns with a critical daily demand zone, which previously acted as a strong support level on the weekly chart.
Market Sentiment Shifts – While retail traders remain bearish, commercial traders (often considered "smart money") are increasing long positions, hinting at a potential trend reversal.
Traders should watch for follow-through buying to confirm whether this is a short-term correction or the start of a larger reversal.
Bottom Line: Oil’s rebound is fueled by fundamentals (lower inventories) and technicals (strong demand zone). With commercial traders betting on higher prices, the stage may be set for a bullish reversal—if buyers sustain momentum.
✅ Please share your thoughts about CL1! in the comments section below and HIT LIKE if you appreciate my analysis. Don't forget to FOLLOW ME; you will help us a lot with this small contribution.

Crude oil PO3I am watching this PO3 for a while now. The invalidation for this would be below the last low and the technical target is at least the range high.
