ABT Buy/LongTechnical analysis of the company. According to financial indicators, the company is currently undervalued and is supported by SMA200. The target price for the company is $142.
ABT trade ideas
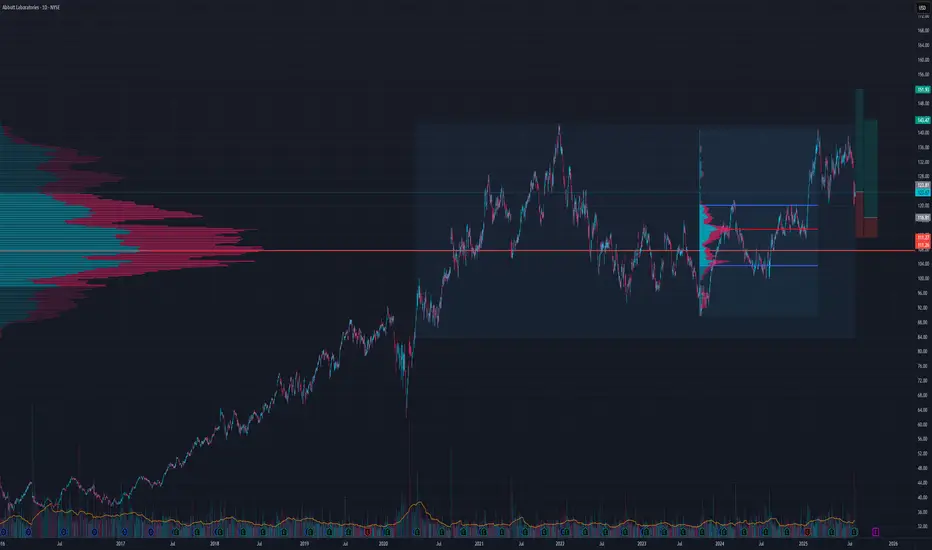
ABT Long TradeVAH retest long here or another pullback close to POC
Good Risk to reward on a solid company
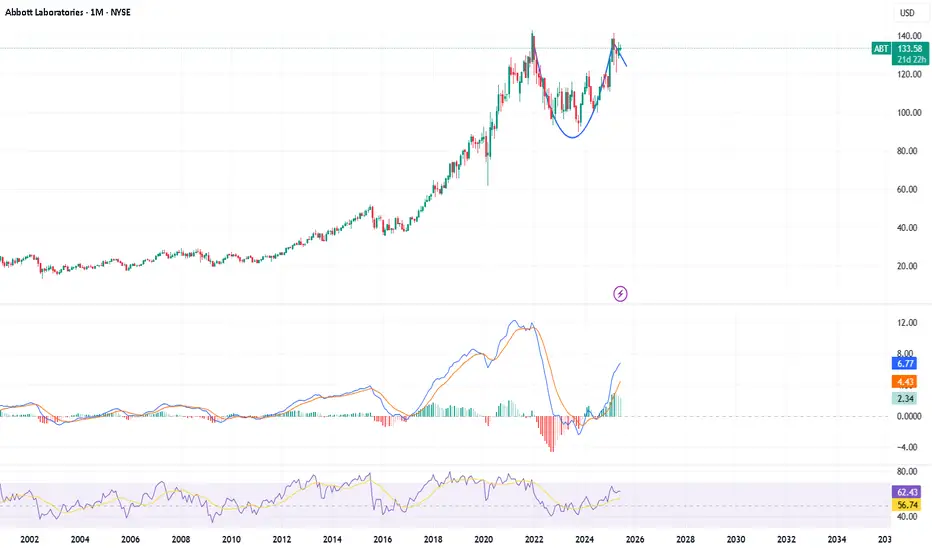
Cup & Handle Formation on Bigger tf.ABT Analysis
CMP 134.44 (06-07-2025)
Cup & Handle Formation on Bigger tf.
Currently Near Resistance Zone.
Crossing & Sustaining 135 - 135.20 may
lead it towards 150 & then around 180.
Should not break 121 now.

ABT on WatchLooking for a break above $137 and then a retest before entering.
Why:
Rounded bottom/saucer
Increased volume on green days
Shakeout on June 9th
Reacting well to previous support and resistance lines

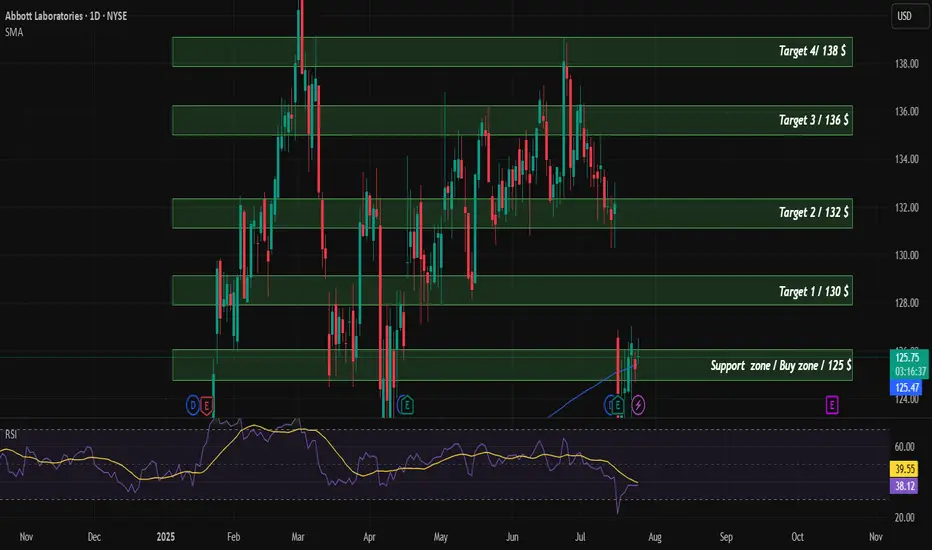
ABT Trade Setup: Breakout Play with 10.6% Upside🏥 Abbott Labs (ABT) Trade Alert
Positioning in this healthcare giant as it breaks out from consolidation - here's the strategic play:
📌 Trade Levels
▶ Entry: $133.12 (confirmed above SMA 50)
🎯 Target: $147.21 (+10.6%)
🛑 Stop Loss: $126.00 (-5.3% risk)
⚖️ Risk/Reward: 1:2
Why ABT Now?
✅ Fundamental Strength:
Net Income Growth: "Strong growth" (+134% YoY in last report)
Dividend Aristocrat: 50+ years of dividend growth (current yield 1.9%)
Debt Health: Score 10/10 (Debt/Equity 0.26, Interest Coverage 15x)
✅ Technical Triggers:
Bullish crossover (50D > 200D MA)
RSI 55 - neutral with room to run
Volume surge on $132 breakout
Measured move target aligns with $147 zone
📊 Trade Management:
Entry: $133.12 (market price)
Scale In: Add at $130 if tested
Adjust Stop: Move to breakeven at $136
Partial Profit: Take 50% at $140
⚠️ Key Risks:
Sector rotation out of healthcare
FDA delays on new devices
Strong resistance at $138 (prior highs)
ABT dominates 4 growth segments:
Medical Devices (44% revenue)
Diagnostics (32%)
Nutrition (12%)
Generics (12%)
Recent FDA approval for Freestyle Libre 3 drives upside.
Trade active until next earnings (Oct 18). Let me know your take! 👇
#HealthcareStocks #DividendInvesting #BreakoutTrade

ABT Chart Looks like #ABT might be on its way to a cup and handle, any thoughts here?
www.tradingview.com
ABT – Clean Technical Setup with Strong Risk/Reward📈 Ticker: NYSE:ABT (Abbott Laboratories)
🕒 Timeframe: Daily
💡 Strategy: Ichimoku + MACD + Risk/Reward Setup
Abbott ( NYSE:ABT ) is showing a compelling long opportunity after a pullback to the Tenkan-sen (conversion line) within the Ichimoku Cloud structure. Price action remains bullish as it respects the cloud, and the MACD just crossed bullish recently—momentum is still positive despite today’s dip.
🔍 Key Levels
Entry: ~$131.53
Stop: ~$128.20 (below the cloud base & local support)
Target: ~$144.66 (previous R1 pivot zone)
R:R = 3.92
💬 Why This Trade?
Price is supported by the cloud and hasn’t broken structure
Strong MACD momentum despite minor consolidation
Healthy pullback offers a low-risk re-entry point
ABT is fundamentally strong with consistent EPS growth and global demand across diagnostics and nutrition
🧠 Bonus: ABT's diversified healthcare portfolio provides a defensive edge, especially during macro uncertainty. Upcoming earnings could be a potential catalyst.


Measured Move Target At 110Pretty simple analysis here:
touch of the bottom Keltner channel
potential weekly anti forming bearish
daily and weekly price action seem to deserve a second leg with the big surprise bear moves.

ABT long at 126.75 -- bad new is good news (for me)ABT got some bad news today when a Missouri judge ruled there would be a retrlal regarding a court case involving ABT's baby formula, and the stock, which was already down 3 days in a row, got thumped. While I don't dismiss long term risk from that news, I'm not in this for the long haul. I will likely be long gone before anything happens with that retrial.
What matters to me is this:
-ABT is one of the top 3% stocks for my system, historically. That rating is based on trade performance, the length of its trading history, and several other factors related to safety and trade performance that I use.
-It is down 4 out of 5 days, and that in itself has some historical precedent as a long trade setup for short-term trades, though I must admit - it hasn't worked all that well for me lately.
-it's in the middle of its 6M high/low range. Not ideal, but not bad either.
-it is still solidly in an uptrend going back to 2024.
-I'm not convinced the market jitters are over and it ideally is less risky than some more typically volatile stocks.
-historical performance (combined actual and backtested) for ABT with my trading system:
1819-0 W/L prior to today
+2.08% average gain per lot traded
18 trading day average hold per lot
Avg. return = .116%/day (2.7x better per day returns than the stock market, historically)
So for all those reasons, I went long before the close at 126.75. Per my usual strategy, I'll add to my position at the close on any day it still rates as a “buy” and I will use FPC (first profitable close) to exit any lot on the day it closes at any profit.
As always - this is intended as "edutainment" and my perspective on what I am or would be doing, not a recommendation for you to buy or sell. Act accordingly and invest at your own risk. DYOR and only make investments that make good financial sense for you in your current situation.

$ABT : Reversal Pattern Just Dropped – Is $115 the NextAlright, let’s check out ABT on the daily chart. The stock enjoyed a steady climb since Jan 2025, riding a clear uptrend line, and now just nailed a technical reversal pattern, and it seems like it’s aiming for a target around $115 per share in the short term (1-3 months).

Abbott Hitting its Top. ABTRSX Divergence and crosses on volatility and stochastic indicators below. A strong change in flavor of candlesticks now, despite no cross of MIDAS. This one has been climbing for quite a bit, and now it might be time for a correction if just a temporary one.

Abbott Laboratories | ABT | Long at $110.00Abbott Laboratories NYSE:ABT has been making higher highs and lower lows over the last year, potentially signaling a reversal in its downward trend. Monkeypox and the return of cold/flu/COVID season may spark another run to close the price gap on the daily chart around $140. It is currently in a personal buy zone at $110.00.
Target #1 = $118.00
Target #2 = $140.00

Abbott and Amazon: Two Bright Spots in a Sea of Red◉ Abbott Laboratories NYSE:ABT
● The stock previously faced strong resistance near the $134 level, leading to an extended consolidation phase.
● During this period, a Rounding Bottom pattern emerged, signalling a potential continuation of the upward trend.
● Following a recent breakout, the stock has surged to its all-time high and is expected to maintain its upward momentum in the coming days.
◉ Amazon NASDAQ:AMZN
● Since August 2020, Amazon's stock has been consolidating, forming a clear Inverted Head & Shoulders pattern.
● After breaking above the neckline, the stock rallied sharply and reached an all-time high near $242.
● Following this, the price pulled back to retest the breakout level and with a successful retest, the stock is now well-positioned to resume its upward trend.

Abbott LabAbbott Lab : Anticipate upside move because of Cup and handle pattern is slowly appearing.

Abbott Laboratories : Check for long positionABT : Look for long position
If the current price crosses the 133 mark, then anticipate the price to move up to 142.

ABT Strong Bullish Momentum – Move Toward $127.00 ExpectedNYSE:ABT is exhibiting strong bullish momentum, supported by a significant breakout above prior consolidation levels. The alignment of moving averages and the strength of recent price action suggest further upside potential, with the next logical target at $127.00.
The price has surged above key moving averages, including the 50 EMA, 100 EMA, and 200 EMA, all of which are trending upward. This confirms sustained momentum and further supports the bullish case.

ABT -CUP and HandleA little late posting this idea but I believe I identified a cup - and- handle pattern on the daily chart in ABT. I was able to enter the trade in the pull back of the 'handle' when volume was starting to dry up at $113.25. Prior to the formation of the pattern there was a ~29% run up on the stock. Playing this conservatively I am setting my price targets at 12% ($134.40) and 24% ($148.8) above the high of the pattern. Where I will sell half of my position at the first target and the second half at the second target. Initially my first Stop Loss is set just beneath the 'handle' at $106.99

$ABT with a bullish outlook following its earnings #StocksThe PEAD projected a bullish outlook for NYSE:ABT after a positive over reaction following its earnings release placing the stock in drift A with an expected accuracy of 50%.

Abbott Laboratories | Chart & Forecast SummaryOn The 15 Minutes Chart You Can See
# A Trend | A Time Frame Conductive
- This Measurement on Session Means;
* Support & Resistance | HH & HL's
and also a
* Trade Area | Focus & Motion Ahead
Containing A Falling Wedge That Acts Like Support On The Valid Target Dotted Through The Arrow Confirmation
The Unnumbered Retracement You Can See Here, Indicates A 50% Retracement What Makes This A Valid Direction To Set Up Further Alliance In, Upwards
On Replay Mode That Means An Uptrend Structured, While Measuring The Trend | Behaviour & Entry Principle. Development Into The Relevant Retracement Area You can Motivate Like This
Overall Conclusion | Like The Trade Plan Execution & Risk Management on Demand This Tells Us;
"It Is A Buy For Now"
Thank You For Watching. See You Next Time

Abbott Labs Shakes Off Downtrend, Sets Sights on $142 milestoneIn December 2021, the stock price hit an all-time high near the 142 mark, after which it experienced a significant drop.
Following this decline, the price found support around the 90 level and began to recover.
Last week, the stock managed to break through the upper boundary of the descending parallel channel, setting the stage for additional upward momentum.
An immediate resistance level is noted at the 122 level, and a substantial movement is expected if this level is surpassed.

ABT Abbott Laboratories Options Ahead of EarningsIf you haven`t bought the dip on ABT:
Now analyzing the options chain and the chart patterns of ABT Abbott Laboratories prior to the earnings report this week,
I would consider purchasing the 115usd strike price Puts with
an expiration date of 2024-10-18,
for a premium of approximately $1.35.
If these options prove to be profitable prior to the earnings release, I would sell at least half of them.

ABTan upward trend in the prices of an industry's stocks or the overall rise in broad market indices, characterized by high investor confidence
