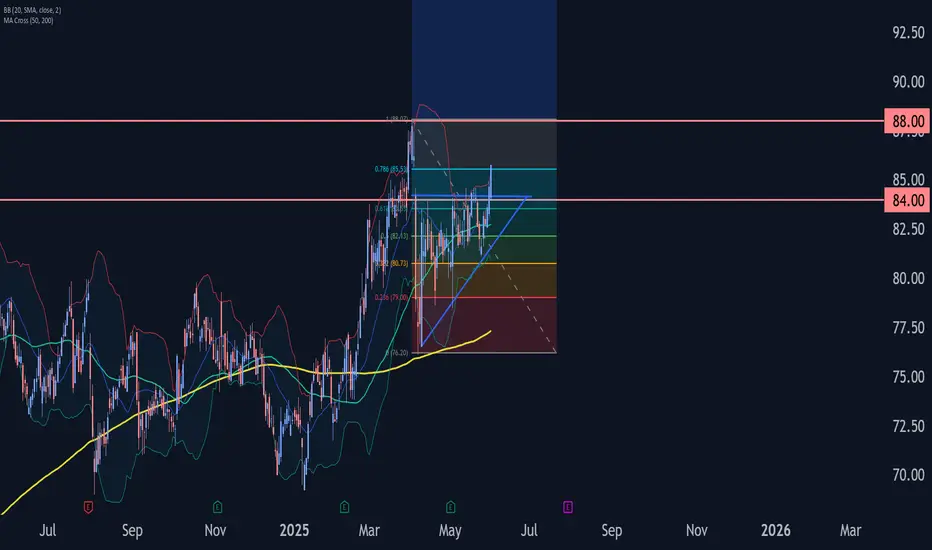
AIG Wave Analysis – 2 June 2025
- AIG broke daily Ascending Triangle
- Likely to rise to resistance level 88.00
AIG recently broke the resistance zone between the resistance level 84.00 and the 61.8% Fibonacci correction of the downward wave (2) from March.
The breakout of this resistance zone coincided with the breakout of the
Next report date
—
Report period
—
EPS estimate
—
Revenue estimate
—
4.52 USD
3.35 B USD
27.25 B USD
574.57 M
About American International Group, Inc. New
Sector
Industry
CEO
Peter S. Zaffino
Website
Headquarters
New York
Founded
1919
FIGI
BBG000BBDZG3
American International Group, Inc. is a global insurance organization, which provides property casualty insurance, offering a range of products, including liability, financial lines, property, global specialty, personal lines and accident and health that help businesses, individuals and jurisdictions to protect their assets and manage risks through AIG operations and network partners. It operates through the following segments: North America Commercial, International Commercial and Global Personal. The North America Commercial segment consists of insurance businesses in the United States, Canada and Bermuda. The International Commercial segment refers to insurance businesses in Japan, the United Kingdom, Europe, Middle East and Africa (EMEA region), Asia Pacific, Latin America and Caribbean, and China. The Global Personal segment is involved in insurance businesses in the United States as well as Japan, the United Kingdom, Europe, Middle East and Africa (EMEA region), Asia Pacific, Latin America and Caribbean, and China. The company was founded by Cornelius Vander Starr in 1919 and is headquartered in New York, NY.
Related stocks
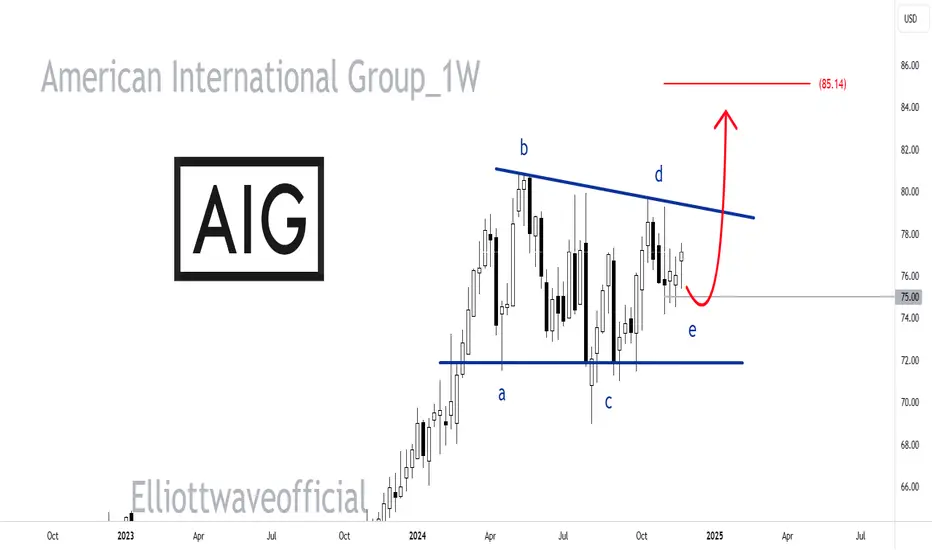
AIG_1Whello American International Group symbol and stock analysis in long term time frame. The market is currently in an abcde triangle correction pattern that could be ready to move for the next rising wave and can move towards 85.00 by breaking the ceiling of the triangle. The main support number is 75
AIG ( American International Group ) BUY TF H1 TP = 75.46On the H1 chart the trend started on Aug. 07 (linear regression channel).
There is a high probability of profit taking. Possible take profit level is 75.46
Using a trailing stop is also a good idea!
Please leave your feedback, your opinion. I am very interested in it. Thank you!
Good luck!
Re

AIG Entry, Volume, Target, StopEntry: with price above 80.84
Volume: with volume greater than the volume from the previous high, in this case > 4.034M. The more volume, the better!
Target: 85.78 area. This is an area, you might consider existing early if price drops below a significant moving average such as the 10, 20, or

AIG ,,, Pullback uptrend
It was a typical pullback to the broken level and there is a good bullish candle over the level as a trigger for getting a buying position.
About 78 can be a good place for setting SL on it.

AIG to sell 20% stake in Corebridge Nippon Life for $3.8BlnAmerican International Group ( NYSE:AIG ) has announced plans to sell a 20% stake in Corebridge Financial to Japan's Nippon Life Insurance for $3.8 billion. The move is part of NYSE:AIG 's efforts to reduce its holdings in the life and retirement business, which it had listed as a separate company

American International Group ,,, waiting for breakoutUptrend
AIG has a very clean and clear chart. I am so positive on it and after breakout of this level, I will get buying position on it.
I will try to hold it or frequently in and out on it. About 72 can be a good place for setting SL.

AIG Soars Above Expectations: Surge on Underwriting Strength American International Group ( NYSE:AIG ) has once again proven its mettle, surpassing profit expectations in the first quarter fueled by robust performance across its general insurance and life and retirement divisions, coupled with reduced catastrophe losses.
Underwriting Brilliance:
AIG's stella

AIG Long -- Sweeping gapsThis is an idea I've yet to do any FA on and is based almost purely on TA.
Currently has a golden cross on 1M and hardly any upcoming resistance. between $117 to $211 is a gap created in Sep '08 amidst the GFC, and a fill could be upcoming.
Dividends upcoming this month (2%) keeping me roped in; u

AIG Quietly Approaches Historic LevelsAmerican International Group had one of the biggest drops during the Global Financial Crisis. Now, after 15 years in the penalty box, the former Dow member could be fighting back.
The main pattern on today’s chart is the January 2017 peak of $67.47. It remains AIG’s highest level since October 2008

See all ideas
Summarizing what the indicators are suggesting.
Neutral
SellBuy
Strong sellStrong buy
Strong sellSellNeutralBuyStrong buy
Neutral
SellBuy
Strong sellStrong buy
Strong sellSellNeutralBuyStrong buy
Neutral
SellBuy
Strong sellStrong buy
Strong sellSellNeutralBuyStrong buy
An aggregate view of professional's ratings.
Neutral
SellBuy
Strong sellStrong buy
Strong sellSellNeutralBuyStrong buy
Neutral
SellBuy
Strong sellStrong buy
Strong sellSellNeutralBuyStrong buy
Neutral
SellBuy
Strong sellStrong buy
Strong sellSellNeutralBuyStrong buy
Displays a symbol's price movements over previous years to identify recurring trends.
AIG4202086
American International Group, Inc. 4.375% 15-JAN-2055Yield to maturity
6.89%
Maturity date
Jan 15, 2055
AIG.JCR
American International Group, Inc. 8.175% 15-MAY-2058Yield to maturity
6.56%
Maturity date
May 15, 2058
AIG4984965
American International Group, Inc. 4.375% 30-JUN-2050Yield to maturity
6.15%
Maturity date
Jun 30, 2050
US26874DL8
AMER. INTL GRP 18/48Yield to maturity
6.08%
Maturity date
Apr 1, 2048
AIG4143451
American International Group, Inc. 4.5% 16-JUL-2044Yield to maturity
6.04%
Maturity date
Jul 16, 2044
US26874DF1
AMER. INTL GRP 15/45Yield to maturity
6.02%
Maturity date
Jul 10, 2045
AIG4266447
American International Group, Inc. 4.7% 10-JUL-2035Yield to maturity
5.72%
Maturity date
Jul 10, 2035
AIG4611930
American International Group, Inc. 5.75% 01-APR-2048Yield to maturity
5.63%
Maturity date
Apr 1, 2048
AIG.GMN
American International Group, Inc. 6.25% 01-MAY-2036Yield to maturity
5.49%
Maturity date
May 1, 2036
AIG4201967
American International Group, Inc. 3.875% 15-JAN-2035Yield to maturity
5.30%
Maturity date
Jan 15, 2035
AIG3911569
American International Group, Inc. 6.82% 15-NOV-2037Yield to maturity
5.26%
Maturity date
Nov 15, 2037
See all AIG bonds
Curated watchlists where AIG is featured.

Frequently Asked Questions
The current price of AIG is 80.10 USD — it has increased by 1.10% in the past 24 hours. Watch American International Group, Inc. New stock price performance more closely on the chart.
Depending on the exchange, the stock ticker may vary. For instance, on NYSE exchange American International Group, Inc. New stocks are traded under the ticker AIG.
AIG stock has fallen by −1.32% compared to the previous week, the month change is a −5.94% fall, over the last year American International Group, Inc. New has showed a 5.70% increase.
We've gathered analysts' opinions on American International Group, Inc. New future price: according to them, AIG price has a max estimate of 98.00 USD and a min estimate of 82.00 USD. Watch AIG chart and read a more detailed American International Group, Inc. New stock forecast: see what analysts think of American International Group, Inc. New and suggest that you do with its stocks.
AIG stock is 1.34% volatile and has beta coefficient of 0.55. Track American International Group, Inc. New stock price on the chart and check out the list of the most volatile stocks — is American International Group, Inc. New there?
Today American International Group, Inc. New has the market capitalization of 45.66 B, it has decreased by −0.97% over the last week.
Yes, you can track American International Group, Inc. New financials in yearly and quarterly reports right on TradingView.
American International Group, Inc. New is going to release the next earnings report on Aug 6, 2025. Keep track of upcoming events with our Earnings Calendar.
AIG earnings for the last quarter are 1.17 USD per share, whereas the estimation was 1.00 USD resulting in a 16.93% surprise. The estimated earnings for the next quarter are 1.60 USD per share. See more details about American International Group, Inc. New earnings.
American International Group, Inc. New revenue for the last quarter amounts to 6.70 B USD, despite the estimated figure of 6.82 B USD. In the next quarter, revenue is expected to reach 6.78 B USD.
AIG net income for the last quarter is 698.00 M USD, while the quarter before that showed 944.00 M USD of net income which accounts for −26.06% change. Track more American International Group, Inc. New financial stats to get the full picture.
Yes, AIG dividends are paid quarterly. The last dividend per share was 0.45 USD. As of today, Dividend Yield (TTM)% is 2.08%. Tracking American International Group, Inc. New dividends might help you take more informed decisions.
American International Group, Inc. New dividend yield was 2.14% in 2024, and payout ratio reached 30.81%. The year before the numbers were 2.07% and 28.09% correspondingly. See high-dividend stocks and find more opportunities for your portfolio.
As of Jul 26, 2025, the company has 22.2 K employees. See our rating of the largest employees — is American International Group, Inc. New on this list?
Like other stocks, AIG shares are traded on stock exchanges, e.g. Nasdaq, Nyse, Euronext, and the easiest way to buy them is through an online stock broker. To do this, you need to open an account and follow a broker's procedures, then start trading. You can trade American International Group, Inc. New stock right from TradingView charts — choose your broker and connect to your account.
Investing in stocks requires a comprehensive research: you should carefully study all the available data, e.g. company's financials, related news, and its technical analysis. So American International Group, Inc. New technincal analysis shows the sell today, and its 1 week rating is sell. Since market conditions are prone to changes, it's worth looking a bit further into the future — according to the 1 month rating American International Group, Inc. New stock shows the buy signal. See more of American International Group, Inc. New technicals for a more comprehensive analysis.
If you're still not sure, try looking for inspiration in our curated watchlists.
If you're still not sure, try looking for inspiration in our curated watchlists.