AIG trade ideas
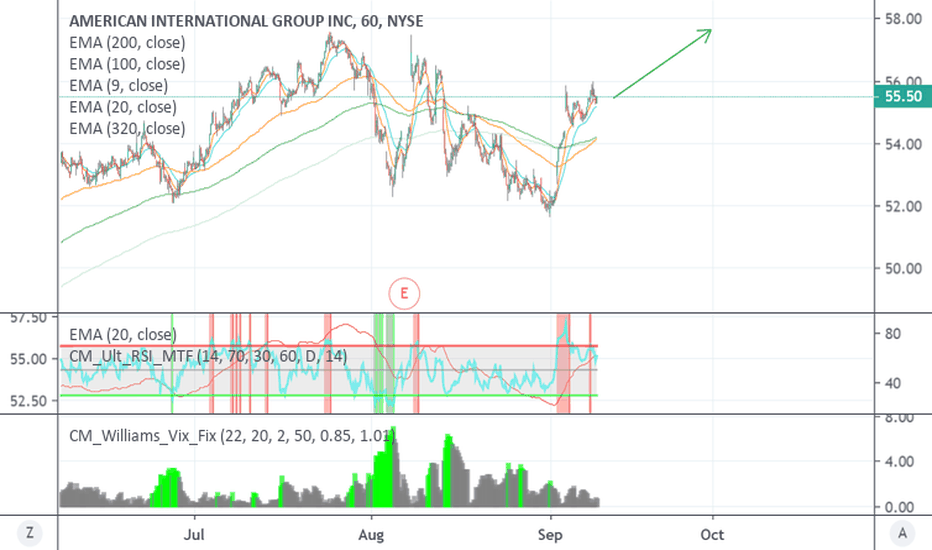
Analysis of AIG 19.09.2019The price above 200 MA, indicating a growing trend.
The MACD histogram is above the zero lines.
The oscillator Force Index is above the zero lines.
If the level of resistance is broken, you should follow the recommendations below:
• Timeframe: H4
• Recommendation: Long Position
• Entry Level: Long Position 57.50
• Take Profit Level: 58.50 (100 pips)
If the price rebound from resistance level, you should follow the recommendations below:
• Timeframe: H4
• Recommendation: Short Position
• Entry Level: Short Position 56.20
• Take Profit Level: 55.80 (40 pips)
USDJPY
A possible short position in the breakdown of the level 107.70
EURUSD
A possible long position at the breakout of the level 1.1065
AIG
A possible short position in the breakdown of the level 0.9900
GBPUSD
A possible long position at the breakout of the level 1.2530
AIG ShortCheap $56 7/26 puts. Lower time frames show weakness. It's been coasting and is slightly overbought. Potential channel that could lead to a low of around $54 with solid moves the next week or 2. Potential wedge squeezing the buyers to turn em into sellers within this channel.
My bags are packed on this one. ready for it to give up.
bear flag on AIG and subdued volatility: put debit spreadAIG currently is trading with an IV30 of 19.6, making its IV Rank 21.8. This low rank indicates that the options will be cheap, and encourages debit spreads, regardless of being bullish or bearish. These spreads will profit when volatility mean-reverts to higher levels.
Because of this well-developed bear flag, we are expecting a continuation of the prior downtrend, thus reversing the immediate uptrend characterized by higher highs and higher lows. To profit off of this, we are doing a put debit vertical by longing the July 26th 54 puts and writing the 53s, for a max potential profit of 41 and capped potential loss of 59, per contract. This is particularly cheap because they expire prior to the expected earnings announcement on August 1st, '19. The break even price is 53.41 because it is being done for a debit of .58. There is max profit below the short strike K = 53.
AIG's Pre GFC Bubble vs. Gold. Interesting similarity.Not that this is necessarily meaningful, but I find the characteristics of these assets rather strikingly similar. While I certainly would not trade off this alone, it kind of cements my view that Gold is potentially due to for a huge selloff here, which is a very contrarian take in today's market environment.
The charts read extremely similarly...
peak exuberance hits then bursts to a low that is half way down the increase since the start of the bubble. For AIG, this was the dotcom bubble, and for Gold, it was the commodities exuberance from 2000-2011.
After initial burst, market stabilizes and the asset recovers, but is a shell of what it was during the bubble era. It rises, bouncing off a new neckline back and forth over the next 7-8 years with smaller waves in each bounce.
At the end of 8 years, the narrowing bounces hit the neckline, and sell off likey in tandem with some variety of crisis).
The crisis breaks the neckline, and the bear market resumes for the asset, forcing technical traders to realize that the previous 7-8 years were a very long bear flag bouncing off a neckline.
And for whatever it's worth, I'm not saying this is a high probability scenario that Gold breaks the neckline, and I certainly don't think it's going to zero. But I think there is a much higher risk of a big selloff in gold than the market realizes.
Perfected ih&s on AIGBeautiful inverted head and shoulders here..
This is a technical trade, setup looks good with volume supporting to the patterns validity. Safe play is entering upon a break of neckline, or on an s/r flip above the neckline
Distance from neck to head is roughly 20%, putting our target in the low 50's. To the right, there is a conveniently situated VPVR gap befitting of this move as well. For me its a buy. will exit upon pattern invalidation!
AIG Channel, Build Up to Earnings!!!AIG looks to be following the depicted Channel as shown by the upward diagonal white lines. The Downward red diagonal line is the longer term resistance for price to breakout of or be pushed back down.
The RSI on the one hour chart is moving to the oversold area and the SMII is also pointing upward, indicating that price for the short term will continue a move up.
It is probable that price will continue on an uptrend following the channel.
Most Probable Scenario:
With Earnings on 2/13 AMC, it is likely that price may reach the red diagonal resistance or the upper portion of the channel, with bearish divergence and a downward sloping SMII. Thus, sending price plummeting downward after Earnings on 2/14.
Probable Scenario:
Price follows the bottom support line of the channel, then plummets downward after earnings. Confirmation of the Bearish Divergence on the RSI and downward sentiment of the SMII cross above zero to trigger the push down.
Least Probable Scenario:
A clear break out above the red resistance will confirm a longer (swing trade reversal), indicating a long entrance.
Like, comment and share. Thank you and happy trading :0)
This is not advice to buy or sell, and is meant for educational use.
AIG for shortIn the last 4-5 bars, AIG attracted very few buy power.
My quant model predicts
Profitability: it has a high probability(80%) to drop below this level (38.75).
Worst Case: it could rise to $41.99
Money Management: Bet no more than 35% of the capital
Suggested Strategy: short stock for 5 Days


