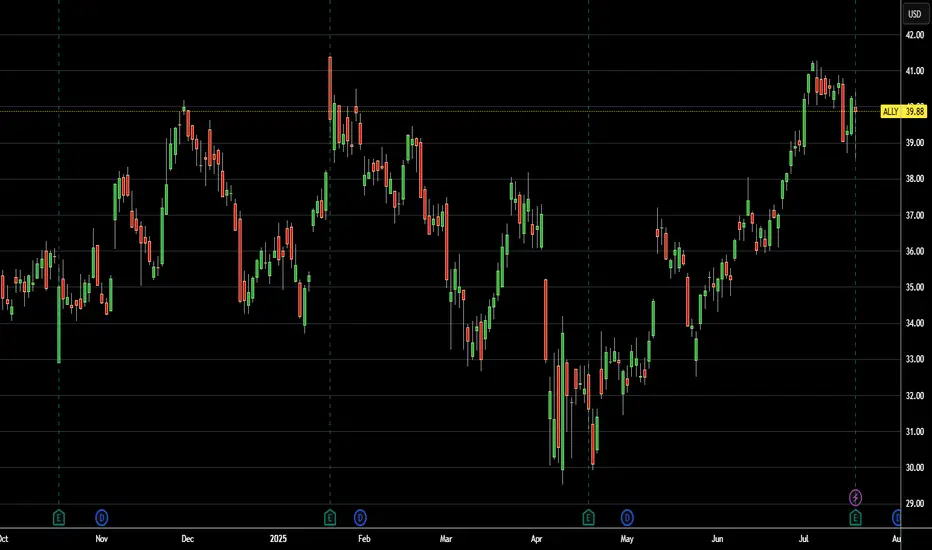
Summary Trade Idea $ALLY🎯 Summary “X-style” Trade Idea
ALLY at $39.88
Signal: MACD + momentum + MA trend intact
Entry: near $40 or on dip to $39.50–39.80
Target1: $45–46 (~12% gain)
Target2: $50 (~25% gain on full breakout)
Stop: below $38.50–39 (just under support/20‑day MA)
Key facts today
Next report date
—
Report period
—
EPS estimate
—
Revenue estimate
—
1.39 USD
668.00 M USD
16.35 B USD
303.66 M
About Ally Financial Inc.
Sector
Industry
CEO
Michael George Rhodes
Website
Headquarters
Detroit
Founded
1919
FIGI
BBG000BC2R71
Ally Financial, Inc. engages in the provision of automotive financing and insurance services. It operates through the following segments: Automotive Finance Operations, Insurance Operations, Corporate Finance Operations, and Corporate and Other. The Automotive Finance Operations segment offers automotive financing services to consumers, automotive dealers and retailers, companies, and municipalities. The Insurance Operations segment includes consumer finance protection and insurance products sold primarily through the automotive dealer channel, and commercial insurance products sold directly to dealers. The Corporate Finance Operations segment is involved in senior secured asset-based and leveraged cash flow loans to mostly U.S.-based middle-market companies, with a focus on businesses owned by private equity sponsors. The Corporate and Other segment consists of centralized corporate treasury activities, such as management of the cash and corporate investment securities and loan portfolios, short- and long-term debt, retail and brokered deposit liabilities, derivative instruments, original issue discount, and the residual impacts of corporate FTP and treasury ALM activities. The company was founded in 1919 and is headquartered in Detroit, MI.
Related stocks
ally idea ally is a great stock owned by warren buffet
we can see a great bullish movement in the next few days

Time to BUY. Time to become an $ALLYKey Stats:
Market Cap: $12.18B
P/E Ratio (FWD): 15.81
Dividend Yield: 3%
Next Earnings Date: Jan 17, 2025
Technical Reasons for Upside:
Breakout Potential: ALLY recently tested resistance around $40, with increasing volume indicating a potential breakout towards higher highs. A move

Short term trade before earning or hold as long term invesment Watch USA data and how the market opens. If I do not decided to enter before earning I will wait for other setup long term. I believe this Stock can hit 180$ in around 5 years. Warrent Buffet holded position.

ALLY Ally Financial Options Ahead of EarningsAnalyzing the options chain and the chart patterns of ALLY Ally Financial prior to the earnings report this week,
I would consider purchasing the 36usd strike price Calls with
an expiration date of 2024-10-25,
for a premium of approximately $1.30.
If these options prove to be profitable prior to th

ALLY FINANCIAL LONGAlly Financial
MTF Analysis
Aly Financial Yearly Demand Breakout 20.6
Aly Financial 6 Month Demand BUFL 28.18
Aly Financial Qtrly Demand BUFL 35.56
Aly Financial Monthly Demand 30.05
Aly Financial Weekly Demand BUFL 31.71
Aly Financial DAILY DEMAND 32.28
ENTRY 31.71
SL 25
RISK 6.71
Tar

Ally Financial's Credit Woes Deepen: Rising DelinquenciesAlly Financial (NYSE: ALLY) faced a steep decline as its Chief Financial Officer, Russ Hutchinson, highlighted worsening conditions within its auto loan portfolio. Rising delinquencies, heightened net charge-offs, and the ongoing struggles of its typical borrower amid a challenging economic environm

ALLY BANK LONGSecured a break above and a retest of the 200 Week MA.
Ready to run!
Already have a position in this- opened a few weeks ago.
Let's aim for the 50's, stop loss below the 200w, though it would take some pretty bad news or an abysmal earnings to go back under it.

Synchrony's Strategic Move to Acquire Ally's Point-of-Sale
In a significant development in the financial sector, Synchrony (NYSE: NYSE:SYF ) and Ally Financial Inc. (NYSE: NYSE:ALLY ) have recently inked a definitive agreement for Synchrony to acquire NYSE:ALLY 's point-of-sale financing business, encompassing $2.2 billion in loan receivables. The move

ALLY Ally Financial Options Ahead of EarningsAnalyzing the options chain and the chart patterns of ALLY Ally Financial prior to the earnings report this week,
I would consider purchasing the 31usd strike price Puts with
an expiration date of 2024-2-16,
for a premium of approximately $0.80.
If these options prove to be profitable prior to the e

See all ideas
Summarizing what the indicators are suggesting.
Neutral
SellBuy
Strong sellStrong buy
Strong sellSellNeutralBuyStrong buy
Neutral
SellBuy
Strong sellStrong buy
Strong sellSellNeutralBuyStrong buy
Neutral
SellBuy
Strong sellStrong buy
Strong sellSellNeutralBuyStrong buy
An aggregate view of professional's ratings.
Neutral
SellBuy
Strong sellStrong buy
Strong sellSellNeutralBuyStrong buy
Neutral
SellBuy
Strong sellStrong buy
Strong sellSellNeutralBuyStrong buy
Neutral
SellBuy
Strong sellStrong buy
Strong sellSellNeutralBuyStrong buy
Displays a symbol's price movements over previous years to identify recurring trends.
ALLY5502193
Ally Financial Inc. 6.35% 15-NOV-2025Yield to maturity
10.20%
Maturity date
Nov 15, 2025
ALLY5201198
Ally Financial Inc. 1.3% 15-JUN-2026Yield to maturity
7.75%
Maturity date
Jun 15, 2026
ALLY5705341
Ally Financial Inc. 7.7% 15-NOV-2033Yield to maturity
7.69%
Maturity date
Nov 15, 2033
ALLY5711874
Ally Financial Inc. 7.45% 15-DEC-2033Yield to maturity
7.45%
Maturity date
Dec 15, 2033
ALLY5700824
Ally Financial Inc. 7.7% 15-NOV-2033Yield to maturity
7.45%
Maturity date
Nov 15, 2033
ALLY5470852
Ally Financial Inc. 4.6% 15-SEP-2027Yield to maturity
7.35%
Maturity date
Sep 15, 2027
ALLY5656541
Ally Financial Inc. 7.3% 15-SEP-2028Yield to maturity
7.34%
Maturity date
Sep 15, 2028
ALLY5648623
Ally Financial Inc. 7.45% 15-SEP-2033Yield to maturity
7.27%
Maturity date
Sep 15, 2033
ALLY5594570
Ally Financial Inc. 7.35% 15-JUN-2033Yield to maturity
7.26%
Maturity date
Jun 15, 2033
ALLY5263289
Ally Financial Inc. 1.3% 15-SEP-2026Yield to maturity
7.25%
Maturity date
Sep 15, 2026
ALLY5652662
Ally Financial Inc. 7.2% 15-SEP-2028Yield to maturity
7.20%
Maturity date
Sep 15, 2028
See all ALLY bonds
Curated watchlists where ALLY is featured.

Frequently Asked Questions
The current price of ALLY is 38.82 USD — it has increased by 0.73% in the past 24 hours. Watch Ally Financial Inc. stock price performance more closely on the chart.
Depending on the exchange, the stock ticker may vary. For instance, on NYSE exchange Ally Financial Inc. stocks are traded under the ticker ALLY.
ALLY stock has fallen by −2.29% compared to the previous week, the month change is a −0.13% fall, over the last year Ally Financial Inc. has showed a −11.63% decrease.
We've gathered analysts' opinions on Ally Financial Inc. future price: according to them, ALLY price has a max estimate of 59.00 USD and a min estimate of 37.00 USD. Watch ALLY chart and read a more detailed Ally Financial Inc. stock forecast: see what analysts think of Ally Financial Inc. and suggest that you do with its stocks.
ALLY reached its all-time high on Jun 2, 2021 with the price of 56.61 USD, and its all-time low was 10.22 USD and was reached on Mar 18, 2020. View more price dynamics on ALLY chart.
See other stocks reaching their highest and lowest prices.
See other stocks reaching their highest and lowest prices.
ALLY stock is 1.53% volatile and has beta coefficient of 1.13. Track Ally Financial Inc. stock price on the chart and check out the list of the most volatile stocks — is Ally Financial Inc. there?
Today Ally Financial Inc. has the market capitalization of 11.84 B, it has decreased by −0.49% over the last week.
Yes, you can track Ally Financial Inc. financials in yearly and quarterly reports right on TradingView.
Ally Financial Inc. is going to release the next earnings report on Oct 15, 2025. Keep track of upcoming events with our Earnings Calendar.
ALLY earnings for the last quarter are 0.99 USD per share, whereas the estimation was 0.81 USD resulting in a 21.89% surprise. The estimated earnings for the next quarter are 1.01 USD per share. See more details about Ally Financial Inc. earnings.
Ally Financial Inc. revenue for the last quarter amounts to 2.08 B USD, despite the estimated figure of 2.04 B USD. In the next quarter, revenue is expected to reach 2.12 B USD.
ALLY net income for the last quarter is −225.00 M USD, while the quarter before that showed 108.00 M USD of net income which accounts for −308.33% change. Track more Ally Financial Inc. financial stats to get the full picture.
Yes, ALLY dividends are paid quarterly. The last dividend per share was 0.30 USD. As of today, Dividend Yield (TTM)% is 3.11%. Tracking Ally Financial Inc. dividends might help you take more informed decisions.
Ally Financial Inc. dividend yield was 3.33% in 2024, and payout ratio reached 66.70%. The year before the numbers were 3.44% and 43.23% correspondingly. See high-dividend stocks and find more opportunities for your portfolio.
As of Jul 29, 2025, the company has 10.7 K employees. See our rating of the largest employees — is Ally Financial Inc. on this list?
Like other stocks, ALLY shares are traded on stock exchanges, e.g. Nasdaq, Nyse, Euronext, and the easiest way to buy them is through an online stock broker. To do this, you need to open an account and follow a broker's procedures, then start trading. You can trade Ally Financial Inc. stock right from TradingView charts — choose your broker and connect to your account.
Investing in stocks requires a comprehensive research: you should carefully study all the available data, e.g. company's financials, related news, and its technical analysis. So Ally Financial Inc. technincal analysis shows the buy rating today, and its 1 week rating is buy. Since market conditions are prone to changes, it's worth looking a bit further into the future — according to the 1 month rating Ally Financial Inc. stock shows the strong buy signal. See more of Ally Financial Inc. technicals for a more comprehensive analysis.
If you're still not sure, try looking for inspiration in our curated watchlists.
If you're still not sure, try looking for inspiration in our curated watchlists.