analysis AMCWe have a breakout of the support line by a big candle with a large volume so we have a big probability of downtrend.
AMC trade ideas

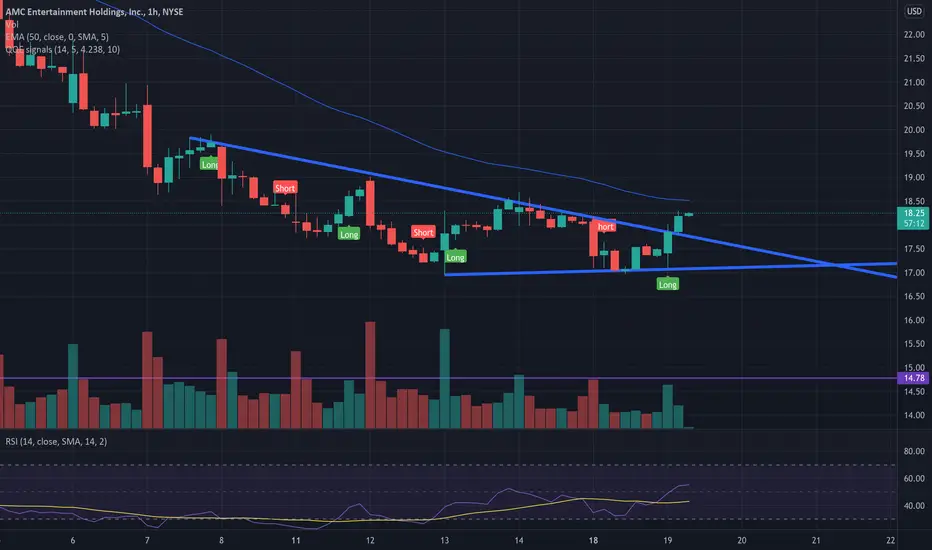
AMC very interesting here, low risk upside. Watch 30mOn daily, if AMC holds bottom of cloud here and 17 (yellow line), it may see buyers for another move up. RSI could move back up again and stochastic looks like it will soon come out of oversold territory (yet to be confirmed).
While 20sma is over the 50, one caution is that price has been consolidating under the 50 these past few days.
I like the 30min chart which looks like price could be bottoming for another move higher. However MA's need to start turning up a bit more.
Buying a few calls now (or stock) is an early entry. Risk is low however, as stops would be the recent low close of 17.42 and 17. I will not use the recent low as a stop because I think a break of 17 will see price head lower.

AMC Repeating Itself?Not financial advice.
It appears to me that AMC is repeating itself.
I would appreciate your thoughts and feedback.

AMC Trend Change.Taking a look at the trend resistance and support.. we now have a confirmed change of trend.. Lets keep stops loose and ride this up!

AMC ascending triangle breakoutAs markets are flippening here, AMC could see. more upside momentum here, keep in mind, its still a casino

Both sides of this tradeAs you can see, this stock is highly controlled by robots. The house always wins, so I strongly advise NOT to buy call options. It is much safer to buy puts, especially if you are holding shares long term. CALLS on AMC 99.9% of the time will expire worthless, even if they are cheap.
Bear situation, we break down below fib level. That's it this stock is finished.
Bull situation, we trade sideways on low volume, Not sure how long, but if we hold at some point there will be a bounce. It will need an incredible amount of volume to break it past the resistance levels. Volume meaning 500+ million shares.
This is a dirty game. Do not waste money on call options.

BULLS LOOKING TO TURN THE TABLE in AMC There is a considerable potential we witness a substaintial reversal on AMC ,there is a high probability the Bulls take the lead on this stock .

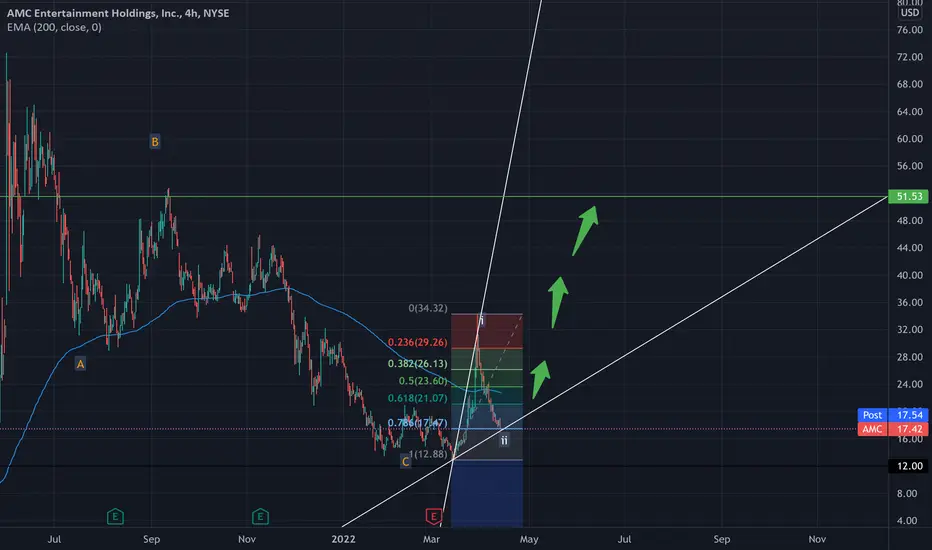
$AMC: Bullish Reversal Incoming?⭐4H chart huge falling wedge
⭐Target of the falling wedge is 34$
⭐7.86 Fib level mounted as support (17.5-17.3$)
⭐20$ Resistance confirmed by EMA Ribbons and large VPVR node on the daily chart + 4h
⭐4H MFI bullish divergence, primed for a large bounce
⭐Strong bottoming signals on the daily chart, TD-Sequential red 9 + Vix Fix indicator. We barely wicked below the Ichimoku Cloud which is bullish. A daily close below the Ichimoku Cloud is bearish.
⭐Descending Volume while price consolidates is bullish
⭐Break and hold above the daily Ichimoku Cloud = Bullish
⭐Right now a daily close above 18.5$ is needed to confirm the bottoming signals
⭐Options chain looks bullish, a weekly close above 20$ is likely.
*WARNING* This thread is not financial advice. I am not a financial advisor.
Thank you for reading.

AMC Rinse & RepeatNot long till we see some confirmation of either a break up or another leg down but if the head & shoulders pattern plays out then perhaps we see the upper regions of $20 - $21.

AMC trend reversal confirmation we got rejected at 33.89$, we didn't hold our support above the 25$, and bear wear in control, now we want to confirm if we ready to reverse , which will be confirmed the moment we over come our resistant around the 20.90$, and hold 4h candle above it, other wise the bears momentum will continue too drive the price low, till near the 11$ support area, or above the 10 the psychological level .

AMC vwap pull back make boom boomDay 1: Wallstreet apes
Apes seem to keep chanting "AMC rocket go boom" and drawing this chart none stop.

likely path for AMCWith the SHF in control this is a likely path for AMC in the short term. I dont see a catalyst that will break the algos ability to keep this down. I think we see a small run up now to the top of the downward wedge just to collect some options prems and then cascade it back down lower yet again. All in hopes of crushing the spirt of the AMC retail investor.


Buy AMCOn AMC we have a breakout with force the vwap indicator by a big candle with a large volume.. So we have a good uptrend..

Bullish Divergence now confirmed.. Long positions are taken. With the constant downward pressure the trend signalled a change as we broke the trend line. The selling pressure is yet to catch up with the move and we have now confirmed the divergence on the RSI indicating that the selling is now losing to the buyers.

$AMC had a short lived Bullish run. What is next?NYSE:AMC
Chart - Daily
EMA (Exponential Moving Average): 20 EMA crossed the 50 EMA but couldn't hold for the next cross over 100 EMA. It is currently trending downwards towards the 50 EMA.
TTM squeeze: All momentum is puff, gone. Squeezing downwards :(
Fib levels: We now have a reversed fib and at .382 it's the beginning baaaaad news. It must fight off .618 or we headed down for the 1 fib ($13.77).
Candle stick: Three Black Crows followed by a Bearish Engulfing. This is baaaaaaaaaaaaaad!
Pattern: Falling Wedge or should I say Bearish Price Channel Continuation.
News: I really think it's just the volatile markets and the continued fed data about CPI, SPI, and War.
History: Well last start first by looking at the previous moves and analysis; We suggested the moves to $27.71 and $31.04 which were right on point. We even got a little extra. The current trends are the exact opposite of the previous analysis. We say this to say that the probability for $AMC to go back to $13.87 (1 fib reversal) is super high given the current market conditions. Especially with today's CPI data of 8.6% for the month of March. Maybe $HYMC could come to the rescue but they seem to be facing the same fate.

AMC Skyrocket ($50 target)It looks like the S&P 500 is bottoming out and meme stocks like AMC have been destroyed. Well not really, because that was Wave 2 and expected after that massive run. Those that have missed that rally, just wait for the next rally and load up now. $50 soon.
Summary on AMC yesterdayGood morning all!! Y
esterday after our analysis we predicted a bearish trend but we notice that the buyers have taken over the sellers hence an uptrend after the breakout of the vwap indicator and at this same time we have a good spring effect on the vwap as you see on the chart.
Today we see that at the openning of the market the sellers forcefully broke the vwap by a big candle with a large volume as you see on the chart, resulting in a downtrend...Thanks...God bless....

AMC - 12 Target within RangeWith all the excitement recently around the #wallstreetbets drama in #AMC many continue to chase the 'what if' and are looking at AMC as something it's not. AMC is the same company it has already been. Until AMC has a change in complexion in the chart structure -- the trend is your friend in the descending direction.
Until the market structure of AMC changes on the charts the sentiment remains the same. Everyone is banking on another short squeeze, but what if that never comes?

$AMC breaking off the downtrend and bouncing the 0.786 FibAMC recently broke off of the downtrend we had since march 29th and bouncing off the .786 Fibonacci, respectively missing it by 14 cents.
If this was the end of the 2nd Elliott Wave, our next impulse lead us to the price target at 1.618 Fib -> $44.59

A 10 month wedge on the weekly coming to an end.This ten month resistance has been a tough one. As you see in picture we rode it down to the support of said wedge. With it coming to an end next month, I’m expecting a big spring up after successfully breaking and holding above the resistance. Nfa so I’m putting no price targets. Hopefully something happens before then. If not I’m patiently waiting for my exit target.

AMC Trend Change.Nice breakout of the falling wedge can lead us to retest the upper regions of the last highs.
