ASAN trade ideas

ASAN - Falling Knife 🔪Quick chart here for @christosgr75, - similar to UPST somewhat, bit more bearish.
There is a weak 1:0.618 fib in this area but that gap down is bad news i think and the most obvious fib is down at $22 from this primary WXY.
3 big strong weekly candles - best to stay out of the way of those, that is a strong trend in motion.
Weekly RSI will most likely go oversold before any higher time frame bounce.
Not advice.

3/3/2022 NYSE (ASAN)Short (Entry Price) below the black line and exit (Stop Loss) above the red line. Can take profit at the suggested Target Price.
Entry Price: $52.90
Target Price: $50.50
Stop Loss: $56.87

Elliott Wave ClassicAsana demonstrates a classic Elliott wave analysis model.
There is a classic upward impulse and a correction in the form of an ABC zigzag, where B is triangle.
Now we have 5 wave upward impulse after the zigzag, which after ATH fell from the price of 145.3 to the level of 43.77, almost touching the strong support level of the top of wave .
I assume that ASAN can go to the 3rd wave with extension, but it's possible also get situation with more complicated correction in the form of WXY as double zigzag.
So, for a short-term trading there is a good opportunity to trade at least wave b of the zigzag as alt. scenario.

ASAN - Elliot Wave PathSee Chart - Looking for a move higher to complete Wave 1 and will be a buyer in Wave 2 Box. CEO has been loading up for quite some time.

ASAN - Double TopPrice has twice bounced off resistance at around $70 forming a double top patten. This signifies a reversal of the prior uptrend and we could see downside unto at least $61 before price finds significant support. MACD also indicates an impending drop in price. Look to enter a short position at market open tomorrow. PT#1 is $61 and PT#2 is 50; place a stop loss just above entry at about $71. This position could pay especially if the broader market drops over fears of a brewing war.

ASANA - Up! ASANAWe are not in the business of getting every prediction right, no one ever does and that is not the aim of the game. The Fibonacci targets are highlighted in green with invalidation in red. Fibonacci goals, it is prudent to suggest, are nothing more than mere fractally evident and therefore statistically likely levels that the market will go to. Having said that, the market will always do what it wants and always has a mind of its own. Therefore, none of this is financial advice, so do your own research and rely only on your own analysis. Trading is a true one man sport. Good luck out there and stay safe!

Make it or break it here.. Im nuetral at the moment 🦉asan stuck between local resistance/support at the moment.
watching for a break over 83.5, if that happens we can target more local resistance areas (99.18-124.39-143.04)
if we reject here its possible we stay stuck between 62.25-83.14 for a while
like and follow for more 💘

$ASAN gap fill LONG to 90. Huge gap, broke out of earnings gap without a problem. Second fib target aligns perfectly.
ASAN $125 PUT 12/17/21 600 @ $59.2 $3.00M ITM

Buying Opportunity for $ASAN 12/1/2021It’s broken far below the 50 day moving average (the blue line). It’s approaching the 200 day (red solid line). This is a really good buying opportunity. I’m buying more to get it at a discount.
It could sell off more tomorrow after earnings and hit the 200, but unless they announce something significantly concerning that signals a fundamental change in the business, I’ll keep buying.

Short Potential Bearish setup on daily chart. Let me know what you all see.
ASAN Short - Bearish setup
* MA 20/10 crossover
* Ascending triangle breakdown on high volume
* Bearish Divergence on OBV indicator
- Potential area to analyze
Break of trendline support which would also be a confluence area for MA100
Entry - Im thinking the closed below Trendline $98-99
Profit area - Test of gap or gap fill ($ 87 - 79) or implied move of pattern $74.

ASANASAN looks like a great candidate for a breakout. It has been consolidating for a month and it is now looking to breakout to form a new ATH.

ASAN - Potential Buy Point1. Confirmed Uptrend
2. Bullish Candle with Quite High Volume
3. Always have a SL

ASAN future potential - known for huge movesHighlighted large volume areas - Looking for a pickup of volume & a break thru 140 whole # - /ES needs to shape up before entry, likely a entry idea for the week beginning with 11/15 - I like to risk 7 days lows INITIAL STOP, for this strategy I am quick to trail my stop once 10% ITM ( in the money )

$ASAN POTENTIAL BREAKOUT #ASANA #STOCKS #momentumI love this stocks for the long term, still so far has a strong bullish momentum


$ASAN EMA reclaim key level to hold above is $111.6 - $112. If if breaks and holds that level $114 - $118 short term PT and will be playing calls.

Bull Flag Pattern on ASAN. Good buy entry right now!NYSE:ASAN chart is pretty self-explanatory. You can put a stop loss below the low of the consolidation.
Good luck,
Your Ganbu
⚠️ Let me know your feedback and comments below!
⚠️ Follow me if you would like to see more analysis like this

ASAN { Short term uptrend } going bullish on ASAN -- we see a correction from its HH and now we see an uptrend
entry prize 104-106
stop loss - 96
target profit - 120-125
not trading or investing advice

Lots Of Interesting Sector Moves Going OnMorning all! Just wanted to post quickly about the recent sector rotations going on, and the overall market selloff. Typically we post our sector updates on Tuesday, but the market continues to selloff so some might get some use out of this directly.
Clearly, the focal point of the market is rates, which have been climbing on stubbornly high inflation. Supply snarls and the energy crunch have cropped up before the supply chain issues could dissipate (and thus reduce prices for goods), and now we are at a point where the market is pricing in higher inflation and a quicker taper than expected - hence the high multiple tech selloff.
And, given that high multiple tech is like 30% of the indices, it's easy to see why we are where we are over the last month.
We think that *all* of this will ultimately clear up over time, but that energy and financials, two sectors that do well in value-tilted/inflationary periods, are most favored at the moment. We think that super-macro deflationary headwinds will prove too hard to defeat in the long term, but that that doesn't matter on a day like today. In times like this, we are sticking like glue to our capital flows models, despite the long term thesis. We'd rather make money than be right.
We are not bidding for any tech stocks anytime soon, but expect to be doing so should the market continue down 10-15% more, especially in the ARKK high mult arena. Some interesting names we like include: $TTD, $NET, $CRWD, $MKTW, and most of the semis.


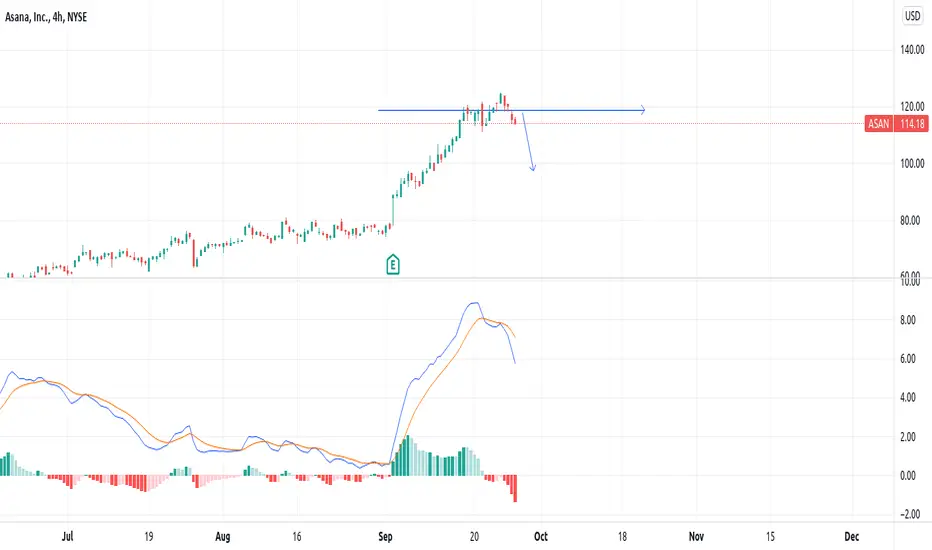
asan ideathis disgrace is loosing momentum, should fall lower, this is a madness no reason why to be this high
ASAN: Bullish Flag (35%)ASAN showing some more positive movement with this bullish flag.
Not confirmed yet though. Still need to break resistance with volume.
If confirmed:
Price Target = 163.77$
Stay humble, Have fun, Make money!
