ASC - the Geometry of a 2nd WaveInteresting shape formed off the resistance lines. It looks like it will drop to the mid 12's but will then have a sharp reversal toward circle A.
ASC trade ideas

ASC Third Wave (Primary)So far, ASC has been a reasonably good wave follower and now looks poised to finish what has been an impressive 3rd wave. Also Love the low P/E, improving liquidity, strong analyst support, dividends, and track record of beating estimates.

(ASC) Ardmore Shipping CorporateASC is profitable, it has been delivering >5% EPS growth in the past 5 years and is projected to deliver >5% EPS growth in the future.
Debt/Equity ratio is <0.8x. I like it when it is less than 1x which means there is some liquidity there.
The shipping industry has been performing really well in the past couple of years due to rising shipping rates despite low volumes.
Even though the rates are declining with the easing of shipping interruptions, there is still high demand to ship globally.
As we go into Autumn and Winter, similarly there is an expected increase in LNG vessel demands.


REVIEW $ASCFA
V - Yes
I - Yes
G - Yes
TA
1 - W Bottom
2 - Broke downtrend line / Making Higher Highs, Higher Lows
3 - Broke major resistance
4 - Above MAs

Ardmore Shipping - Up 300%Ardmore Shipping engages in the seaborne transportation of petroleum products and chemicals worldwide.
It is up a bit over 300% over the last 12 months and is going through a bit of a pull back to a better value area.
Could be worth a watch to see if it recovers and continues to run.

Hold out for ASC to pull backI've been interested in ASC since I opened my positions in Teekay Tankers (TNK) and Frontline Ltd. (FRO). The macro background is very positive for this sector based (e.g. transporting petroleum products). However, this price action has gone parabolic. Looking at the monthly chart it's a straightline up. It's in monthly and weekly exhaustion. Weekly volume is tapering off. Add to this macro headwinds with China lockdowns/protests. This might an opportunity for people who have been on the sidelines to open positions. I'll be watching for 38.2% or 50% as these also align with 2019 swing test and right before large volume profile nodes.


ACS had i been watching, could have been a decent start to a trade.. once it cleared the prior res from the last two days..

ASC - LongASC has been the gift that keeps giving for me.
It has strong Growth characteristics that the market is seeming to reward once again. Alongside this the company is an energy transportation play which is a sector I am focused on given the European energy market
The 20EMA acts as a Support, with the company riding this up and rarely breaching it - yesterday you can see that the stock came within a few pennies of touching the 20EMA, but this was then rejected.
Keeping stop very tight as if it does breach the 20EMA I am out

ASC - Long (with caution)Got in ASC Long
Happy to take a 4% risk as I got a great entry (for once!)
Coil breakout into new multi year high
EMA Uptrend
This is a smaller position than usual given there are concerns over profitability and valuation

ASC BullishMACD and the Force Index recently crossed and the most recent candle tested the .5 fib level and the descending trend line only to close just under both.
In addition 50% of shares traded in the last 12 months have traded in the 6.94- 7.79/ share with the most at 7.47. I would like to see a close over 7.28 to initiate a long swing trade.
Targeting: 7.50, 7.84, 8.25

$ASC Breakout Setup50 Day MA Test. Tightening up now after solid reaction. Trend somewhat long in the tooth but nice setup for All Time Highs.

ASC New 52 Week High*ASC Made a New 52 Week High
*Volume picking up
*Last dip held by 200DMA
*1 Year Long Base

Short term long??I saw this and thought I would publish a idea and follow it along, checking in along the way to its eventual bottom and reversal. Just a guess

maybe this time we wait for a buy indiactor and then go up?You take responsibility of your own trades!

Waiting for a buy and then up to change a trend? let's seeYou take responsibility of your own trades!

$ASC weekly chart C&H pattern breakout$ASC is another Oil&Gas shipper that is breaking out from a multi year consolidation/bottoming pattern
Since the OCT'16 low the stock has been trading/consolidating/bottoming inside a box (trading 5.00-9.05 range) with an attempt to break down during the DEC'18 capitulation
Starting with the summer 2018 the stock has formed a C&H pattern on the weekly chart
This week stock has broken out from both formations , with above avg vol and supportive MACD and RSI
Measured targets are by coincidence almost identical: T1 - from the C&H is 13.08 / T2 - from the box is 13.10

ASC, Stochastic Oscillator left the oversold zone on July 01, 20This is a signal that ASC's price trend could be reversing, and it may be an opportunity to buy the stock or explore call options. Tickeron A.I.dvisor identified 65 similar cases where ASC's stochastic oscillator exited the oversold zone, and 56 of them led to successful outcomes. Odds of Success: 86%.

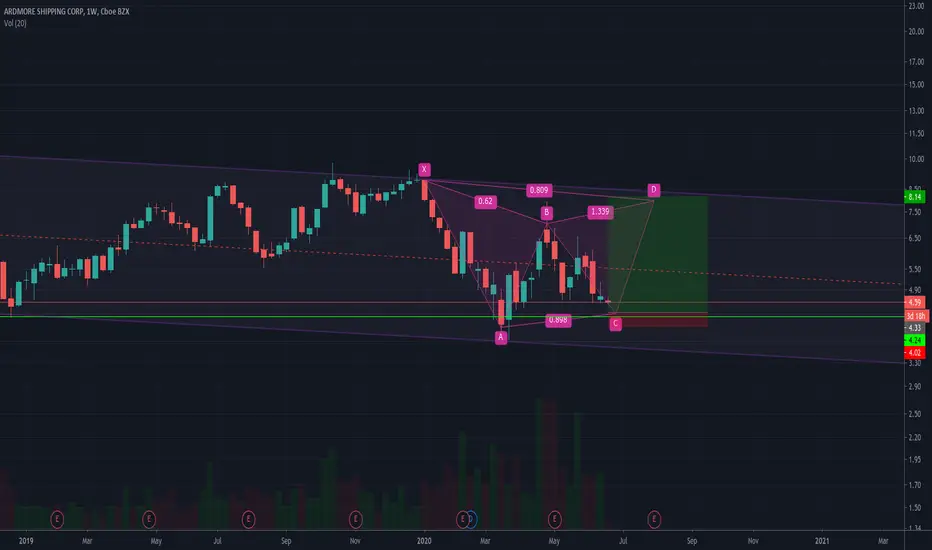
Gartley pattern / Long setup on this oil tanker companyIf the economy starts booming again, we shall see this Oil tanker company raise in value.
So I am looking to go long at the C point around $4.23 with a tight stop loss if we break the support.
Take profit target is on chart, which corresponds to the top of the channel. If this scenario plays out, I'd look for a short next.
$ASC Close for the break of the big 10What I like on this stock is the ascending trend above every moving avarage, is some kind of ascending triangle close to the 10 big resistence, the target on this one will be the SMA200 in 10.54, and the stop in 9.19 (al the SMA area)
