AU trade ideas

ANG Long IdeaANG Long continuation
Volatility has increase and a rush to safe haven assets
was expected in December this new virus has escalated risk
and facilitated sooner than expected precious metal purchases

AU long Update at 15.14Daily stoch look good above all MA may fill gap. May gap go. VOL red hmmm I added
Weekly looks great watch it may just go sideways above 70% and AU climbs 26 my target


AU long Update at 15.14Daily rolled over pull back to 100 day ma 17.85
once breaks above 200 day boom. 25 day crossed up through 50 day and know 100 day bullish
weekly uptrend going sideways


ANG LONG ANG Finding Resistance
sure signs of support possible continuation of upward trend
wait for the confirmation but add if share falls further

#VIllageTraderZA Inverse Head and Shoulder on Anglo Gold
We have an inverse head and shoulders pattern, with the right shoulder being slightly higher than the left shoulder. The stock is battling with the 200 day EMA. If the stock can break the 200 day EMA. That would be a buy signal with a stop loss at R262 and a profit target of R378. Assuming R295 as an entry level
Risk R33
Potential reward R83
R:R of 2.5

ANG longANG management has set this stock to be asset of the future
with current asset purchases and expansions the mine is in prime spot
to be the stock of the next decade - hedge on inflation

AU long Update at 15.14Daily starting roll over so a pull back coming see 25 day crossing up thru 50 day vol pretty good. Nice daily engulfing candles
Weekly absolutely pretty heading up.
So far up 25%

ANG longANG market reversal possible break to the upside
higher highs and higher lows with volatility
market mover with potential due to asset purchase

ANGLOGOLD - Gap close- The gap created in the sell off (6th August) has now been closed
- Next stop is a likely test of the downsloping 200 day moving average.
- Gold had a decent pop up off the inflation data out of the US
-- MANAGE YOUR RISK - -
Disclaimer: All ideas are my opinion and should not be taken as financial advice.

AU long Update at 15.14Daily rolling over nice higher lows nice vol.
Weekly great looking going to 200 day 20.46

AG Capital -Storm trading Morning Call 6 October 2021We give a quick recap of markets overnight and the previous day and insights into the day ahead with a few trade ideas on the day. Ideas are strictly NOT INVESTMENT ADVICE.

AngloGold Ashanti at R600. Remember That?This morning, pre-market, I published a technical note focusing specifically on key levels for JSE PGM and Gold shares, what the medium term outlook is and whether or not they are a buy at current levels.
One of my main comments were: ' at some point these names will be opportunities for the mean reversion trader .'
As you know I consider the chart in various time frames and from various angles as a technically-focused analyst is supposed to, with the monthly chart having the highest priority.
For ANG and it's peers, it reminded me of May to July 2020, when these names were trading at massively elevated levels.
One of my main concerns at the time was that the constituents had advanced significantly. ANG itself was +430% from it's May 2018 low (at the time, a massive move in two years).
My focus was the monthly chart, using the indicators, extension and peaks to come to the conclusion that a pullback was imminent (see attached short idea on ANG dated 18-May-2020).
From above R500, the price dipped before advancing to trade above R600 and then beginning it's multi-month decline to R232 at today's close (that's a -62% downside move from the July 2020 peak)). In between there has been tactical (short term) trading opportunities on both the long and short side.
For those traders, or more so investors with longer time horizons, a focus on the monthly chart at the time may have helped to manage risk by shifting capital to a better-suited opportunity within a larger portfolio.
Possibly, the questions you may want to ask yourself is:
- What are you doing to manage risk from a technical perspective?
- Is your PM controlling the risk with effective tools?
- Do you think an alternative technical perspective could add value to your own process?
If you need help navigating the market, with a diverse and experience technical perspective, get in touch today.

Potential Bearish Flag on ANGJSE:ANG made a string downward move early in August. Since then it has been consolidating in a slight upward direction. Although not confirmed yet, this might be the formation of a bearish flag pattern. If it breaks through the bottom of the consolidation area, we could possible see a downward move as far down as the length of the original flagpole. I will wait for confirmation first before entering.

Anglogold Ashanti- Medium Term: Must hold ~R230 or risks move to ~R209
- ONLY bullish if it can reclaim R267. This will negate the large head and shoulder topping structure.
- A closer, zoomed-in look sees a possible short term bear flag developing.

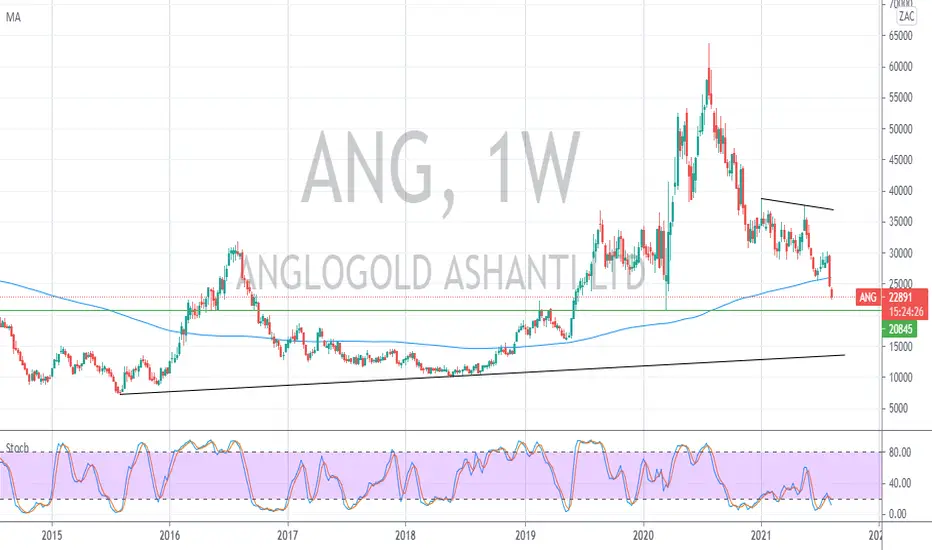
ANG -1D - OVERSOLDThe same analysis as for Harmony or any gold counters for that matter. Only difference would change my stop loss to 20,845. Please look at my analysis for Harmony gold.
AU Long @ 15.58Playing the daily stoch turning up stock basing need hold the low
Weekly not ready pure daily stoch play , not only reason uup about drop
Gold got beat fu up inflation roaring and getting worse.

Anglo-Gold AshantiSometime in February 2021 I posted a chart showing a break of what looked like a bear flag, and how that break could target 200.
Price at time of posting was around 330/340.
The move did not happen in a straight-line but as of today's close, price is about 27 shy of that 200 'short' target.
Original idea quoted below.

Analysis on JSE:ANGThis is an analysis on AngloGold Ashanti. From an inflation point of view I think this is a good stock to invest in as gold is also now turning the trend more upward, ANG could also have a big swing up.
Disclaimer: This is just my opinion on the stock. Tread carefully and best of luck to all the other investors out there!

Potential quadruple bottom at R294ANG has shown support at R294 three times already and last week it touched that level once again. This looks like a nice R:R trade with a stop loss a close below R290 and target at R320 with a potential for further upside to R340.

Anglogold AshantiANG has declined from R377 on 19 May to today's low of R303. At current levels, the reward-to-risk appears attractive for a short term buy/long trade, in anticipation of a rebound. Note the price trading close to horizontal support and back-testing the trend line extending back to the peak of 05 January.
Buy Range: 30300c-30600c
Stop-loss: 29400c
Target Range: 32600c-33000c
Current Level: 30515c
Note: Small bullish divergence on the Rand and the idea may be worth considering if the currency gives up it's gains. Also, some Rand Hedges (ANH and BTI) have been flashing, hitting intraday highs throughout the day.
