AU trade ideas
ANGLOGOLD- A hidden gem As Gold climbs mining companies to. I have taken several positions with this mining company.
The trend has gone parabolic. Unlike the crypto world these stocks have fundamentals and clear tell tale signs of continuation.
This bad boy might cool down, but its safe to DCA into loooooooooong term positions. Top analysts are saying GOLD is going to the moon, so this will automatically follow.
Did I mention it is in the top 3 of Gold Mining companies in the world?
ANGLOGOLD ASHANTI LTD 35% upside potential.======BREAKOUT LEVEL $22.50========.
======UPSIDE POTENTIAL TARGET $31.=======.
INDICATORS ARE OVERBOUGHT SO A PULLBACK TO TEST SUPPORT IS VERY LIKELY.
AngloGold Ashanti Ltd. is a mining and exploration company. It explores, mines, and produces gold. The company was founded in 1944 and is headquartered in Johannesburg, South Africa.
Anglogold Ashanti60-Min Chart
- Potential Double Top Formation (Price Failing)
- Incline support is being breached.
- A break below 322.00 and we could see 309.20 and 303.00 act as targets.
- Additional confirmation of downside potential would be a break of the RSI incline support (currently taking place).
JSE:ANG AngloGold Lots StrengthAngloGold has been the strongest stock of the gold miners and the strength continues. There have been some reaccumulation ranges that have formed. The latest range has been an upsloping range with institutional buying on the way up seen by the increased volume on the increases. We have seen a spring and break of the recent TR with volume pushing it along. Negative divergence points to effort to push the stock down but with no response due to institutional buying. Good times for ANG.
ANG - Major Level!We may derive the following from the Monthly ANG chart:
1. Price is at a monthly downtrend level.
2. A reversal may indicate long term bearishness.
3. I suggest watching this level closely.
4. NB: The trend is still up - so be cautious in selling.
5. As always - maintain your risk.
Note: The views provided herein do not constitute financial advice.
Anglogold Evening Star PatternJSE:ANG has formed an evening star pattern which is a top reversal signal. I will wait for it to break below the 18th of June's candle.
After a preceding up trend, 2nd real body must be above the 1st and 3rd candle bodies. The 3rd candle must close below 50% of the 1st real green body. Colour of the small 2nd real body doesnt matter.
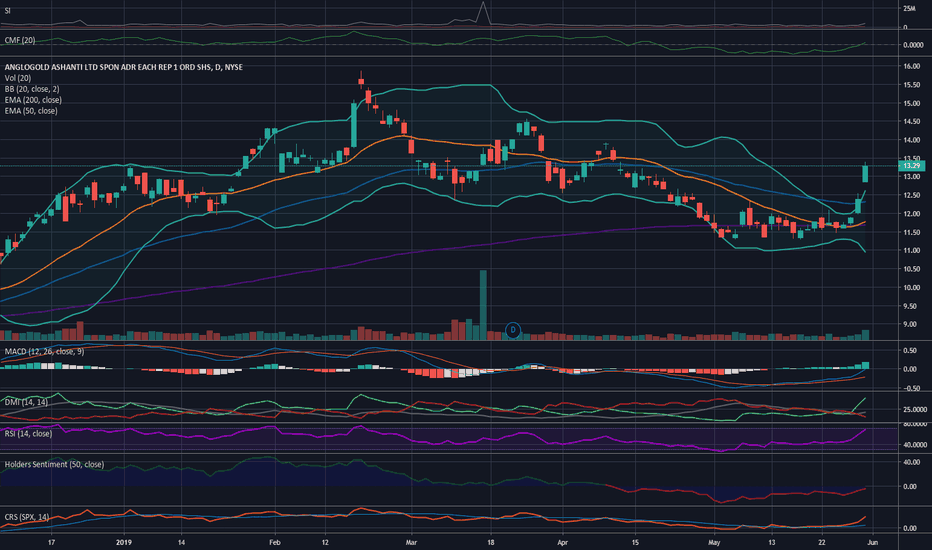
AngloGold Ashanti: Gold Above 1300 AgainGold is starting to rise in price again which I've been expecting with the recent global economic landscape of trade wars and tariffs. AU is in a good position of having solid growth coupled with relatively cheap stock price with significant upside potential. It's outperforming GDX and SPX and all technicals look good for a rally over the next week. Volume has steadily risen over the past week, and I foresee it spiking hard the coming days.
MACD just broke positive with a strongly rising histogram showing an accelerating momentum. RSI broke and held 50 at close for two trading days but isn't overbought yet. Looking at trendedness has ADX just breaking over 20 for a weak trend, but DI+ rising sharply over DI- shows that the forming trend is accelerating quickly. The 50 day momentum for holders sentiment still shows negative but is steadily climbing, so it looks like long term holders will go overweight soon, too. Chaikin money flow just broke positive, so it looks like institutional investors are looking to the gold mining industry in pursuit of alpha against the market headwinds.
I'm entirely out of DOW30 and S&P500 stocks at this time, and I'm looking at mostly bond funds and very specific, niche small and mid cap investments at this time. I'll continue to ride AU as long as the forming trend holds out and I remain profitable in the position, and I did well to capture some of Friday's gain by purchasing early in the trading day.


