Avery Dennison Corporations broke out of trading rangeA Trading range or consolidation has formed and has broken out during the weekly chart. This indicates that the price levels are going to go higher to the next high
AVY trade ideas

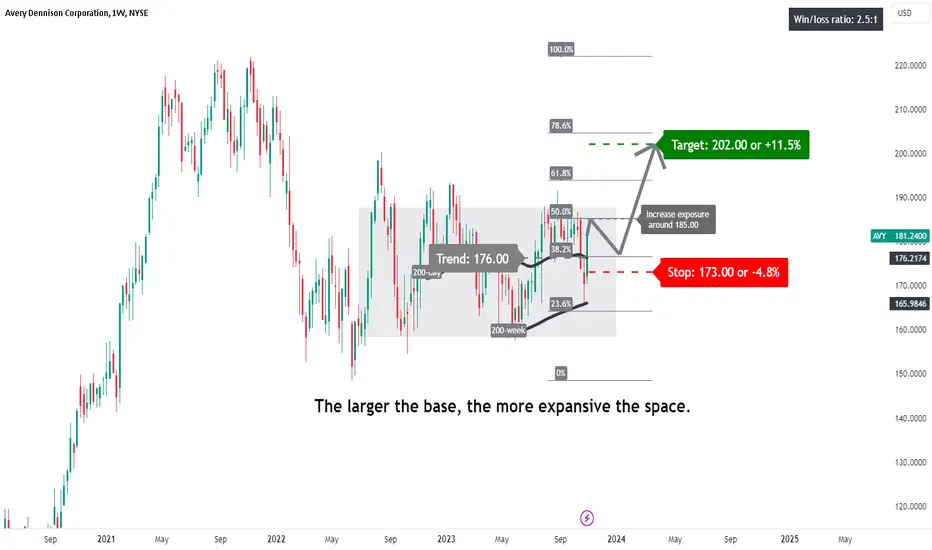
AVY: building a baseA price action above 176.00 supports a bullish trend direction.
Increase long exposure for a break above 185.00.
The target price is set at 202.00, just below its 78.6% Fibonacci retracement level.
The stop-loss is set at 173.00.
Testing its 200-week simple moving average.
Building a base. The larger the base, the more expansive the space.
Avery Dennison Corporation WCA - Symmetrical Triangle Company: Avery Dennison Corporation
Ticker: AVY
Exchange: NYSE
Sector: Industrials
Introduction:
In our analysis today, we're looking at Avery Dennison Corporation (AVY) on the NYSE, an industrial sector company. The weekly chart displays a potential bullish reversal in the form of a Symmetrical Triangle pattern that has been developing over the past 58 weeks.
Symmetrical Triangle Pattern:
The Symmetrical Triangle pattern usually indicates indecision. In this scenario, it seems to be acting as a reversal pattern from a previous downward trend
Analysis:
Avery Dennison's previous trend was downward, demonstrated by the diagonal blue resistance line. However, this trend appears to be interrupted by a consolidation phase shaped like a Symmetrical Triangle, suggesting a potential reversal. This triangle pattern has 2 touchpoints on both the upper and lower boundaries.
The 200 EMA is acting as support in this case, and the price is holding above it, indicating a bullish environment. A breakout above the diagonal resistance would signal a potential long setup. Should this breakout occur, we could anticipate a price increase of approximately 29%. Until such a breakout, Avery Dennison remains a candidate for watchlist monitoring.
Conclusion:
Avery Dennison's weekly chart presents a potential bullish reversal scenario, signaled by the Symmetrical Triangle pattern. This pattern, if confirmed by a breakout above the diagonal resistance, could provide an attractive long trading opportunity.
---------------------------------------------------------------------------------------------------------------------
Remember, this analysis should be part of a broader market research and risk management strategy and is not intended as direct trading advice.
If you found this analysis beneficial, please consider liking, sharing, and following for more insights. Best of luck with your trading!
Best regards,
Karim Subhieh
Disclaimer: This analysis is not financial advice and is meant for educational purposes only. Always do your own research and consult with a financial advisor before making any investment decisions.

AVY - Opposite TrianglesTriangles are similar but angled oppositely.
From this we can assume that the upper triangle will break down, as price entering the first triangle was upward movement.
Also the structure above the solid green line does look like a top structure.

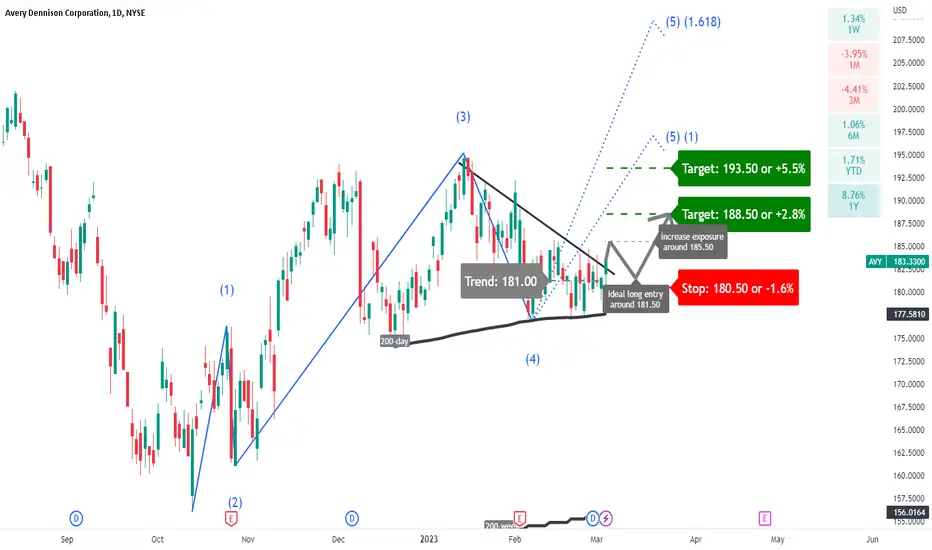
AVY: upside potential?A price action above 181.00 supports a bullish trend direction.
The ideal entry price is around 181.50.
Increase long exposure for a break above 185.50.
The first target price is set at 188.50.
The second target price is set at 193.50.
Stop-loss for a break below 180.50.
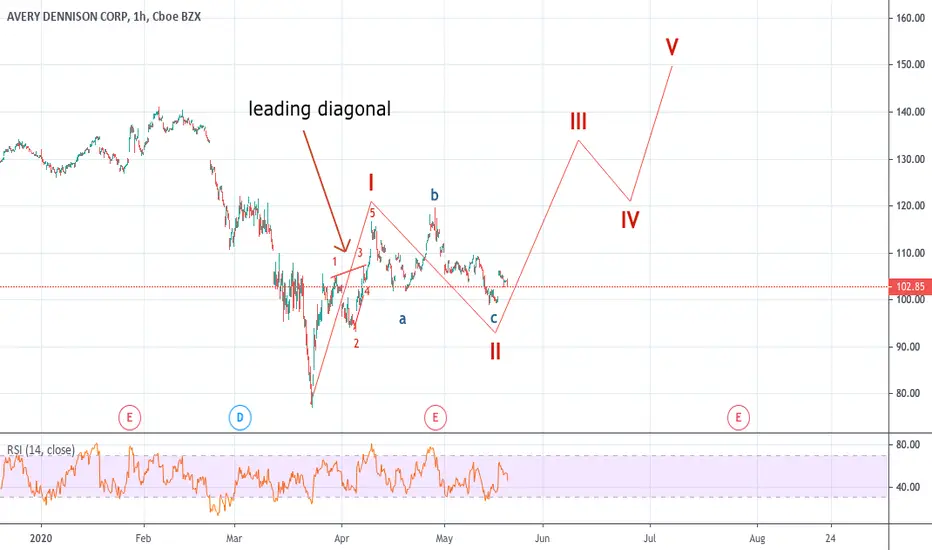
A fifth and final leg out of the Elliott wave analysis might unfold.
$AVY with a Bullish outlook following its earnings #Stocks The PEAD projected a Bullish outlook for $AVY after a Positive Under reaction following its earnings release placing the stock in drift A with an expected accuracy of 64.29%.

Low Risk Cup and Handle Entry on AVYAVY is completing a big cup and handle pattern. Earnings were up 77% last quarter and sales grew by 38%, so the growth is definitely there. The cup depth is only 13%, so my initial target would be around 260.00. But the risk is very low as well. We have a tight handle on the right side of the chart. If the current low holds, you could buy the breakout with just a 3% risk.

AVY broke out of 4 months of consolidation* Long term strong up trend
* Solid earnings year over year
* Broke out of a 4 month consolidation period
* Still holding above with higher than average volume


🟢 +8%: #Buy Stop #AVY @164.03 / TP 177.05 / SL 159.69🟢 +8%: #Buy Stop NYSE:AVY @164.03 / TP 177.05 / SL 159.69

AVY - 7.83% Potential Profit - Ascending TriangleAscending Triangle broken out after a 6-month bull run with a 3-month correction.
We are trying to capture the run right out of the gate, hence there is limited support confirmation. However, momentum is there and the RSI / STOCH / MACD are on our side.
- Target Entry $128.05
- Target Stop Loss $126.00
- Target Exit $137.85
About me
- P/L September +33.74% | August: +203.83% | Historical Win Ratio 75.00% | No Trades without Analysis
- Note that I tend to adjust stop losses in order to secure profits early and preserve capital. This means that the target price is going to be achieved as long as there are no strong pullbacks that trigger my new adjusted stop loss

BIG Potential for AVERY DENNISON CORPHey guys, AVERY DENNISON CORP is in a bullish push with a hammer candle and a large past sell volume. We see a bullish continuation on the TIMEFRAME 5 Min and in the 1 Min we can see the shadow. Which affirms a rejection of buyers with strong potential to break the Vwap in force. Then breakout the consolidation zone and join a new zone, AVERY DENNISON CORP will fill half of the bullish gap. To arrive on the last bearish candle, which corresponds to the highest of the zone.
Please LIKE & FOLLOW, thank you!

Follow up for LongBroke the resistance at 134.5 with high volume + weekly Engulfing
Long now or wait for retest of resistance


AVY - Possible H&S short formation AVY seems forming a potential H&S formation. It seems it has broken its neckline and showing strong downward momentum. There are some inside selling as well. We think it has good downside potential.

AVY approaching resistance, potential drop! AVY is approaching our first resistance at 99.97 (horizontal overlap resistance, 38.2%, 50% Fibonacci retracement, 100% Fibonacci extension) where a strong drop might occur below this level pushing price down to our major support at 91.37 (50% Fibonacci retracement).
Stochastic (34,5,3) is also approaching our resistance and we might see a corresponding drop in price.


AVY: Sort opportunityAn intraday high potential, Back Tested Sort Analysis.
We ll try to enter into the correction of the uptrend movement.
DETAILS ON THE CHART
NOTE: Entry range area above the entry point, is calculated upon 80% of the recorded pullback back tested past performances
DISCLAIMER: This is a technical analysis study, not an advice or recommendation to invest money on.


$avy broke multiple time frame resistance$avy broke resistance and now has a high probability to continue bullish trend. #stocks #stock #options #option #support #trading #market

AVY- Short at the break of 68 AVY forming a potential flag formation. Moneyflow is deep on the negative side. Break below 68 will be confirmation of the flag breakout.
You can check our detailed analysis on AVY in the trading room/ Executive summary link here-
www.youtube.com
Time Span: 6:50"
Trade Status: Pending
--------------------
