American Express Wave Analysis – 8 July 2025
- American Express reversed from key resistance level 325.00
- Likely to fall to support level 310.00
American Express recently reversed from the resistance area between the key resistance level 325.00 (which stopped the sharp daily uptrend in January) and the upper daily Bollinger Band.
The downward reversal from this resistance zone created the daily Bearish Engulfing, which stopped the previous minor impulse wave 3.
Given the strength of the resistance level 325.00 and the overbought daily Stochastic, American Express can be expected to fall to the next support level 310.00.
AXP trade ideas

AXP Breakout Trade – Triangle Pattern Alert!🚨 🚨
American Express (AXP) has bounced perfectly off trendline support and is now breaking out of a descending triangle. Price action shows buyer strength stepping in near $320.22 with a clean breakout retest at $322.63.
📌 Trade Details:
🔹 Entry: $322.63 (breakout candle)
🔹 Stop Loss: $320.22 (below support)
🔹 Target: $332.22 (previous resistance zone)
🔹 Chart Pattern: Symmetrical Triangle Breakout
Breakout backed by bullish structure and strong recovery from higher lows. Watching for follow-through with increased volume.
💡 Risk smart — follow your plan!
—
📊 Shared by: ProfittoPath
#AXP #AmericanExpress #TriangleBreakout #SwingTrade #TechnicalAnalysis #TradingView #ProfittoPath #StockSetup #BreakoutStock

AXP | New All-Time High BreakoutAmerican Express (AXP) just broke above its previous all-time high, pushing into uncharted territory with strong bullish momentum.

$AXP – Potential Double Top Formation? Price is approaching a previous high near the $319–$320 level, where it faced strong resistance earlier this year. Watching closely to see if it breaks out or forms a double top reversal.

AXP Long Trade Alert!📈 🚀
🔼 Breakout confirmed above resistance 💥
🎯 Target: $315.36 | 🛡 Stop: Tight
💡 Setup: Trendline + Bullish Momentum ⚡
📊 Chart powered by #ProfittoPath 🔍
#AXP #LongTrade #BreakoutPlay #StockMarket #TradingView

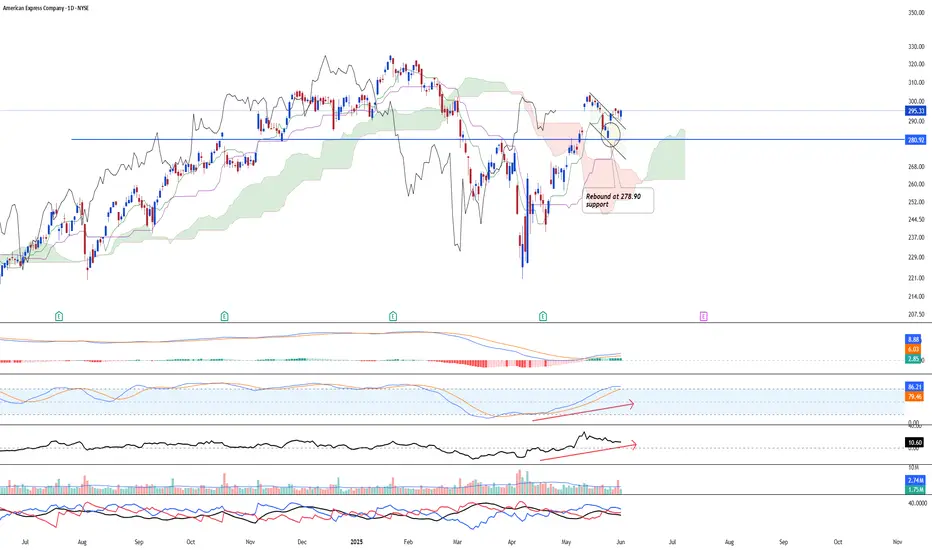
AMEX looking to continue its upside NYSE:AXP looking at a strong bullish upside and is likely to see continued upside after the stock saw steady rebound at 280.92 resistance turned support. Furthermore, all long to short-term momentum indicator are showing signs of bullish momentum returning.
Stock Watch: AXP (American Express Co.) 🚨
We're eyeing AXP for a strategic multi-entry swing trade based on strong technical structure and long-term potential. Here's the plan:
📌 Entry Points:
1️⃣ $248 – First touch on short-term support
2️⃣ $234 – Healthy correction zone
3️⃣ $219 – Strong base of demand
🔻 Deeper Load Zone: $195 – Long-term trendline + major accumulation area
💰 Profit Targets:
✅ $285 – Previous resistance / key breakout level
✅ $300 – Psychological barrier & momentum zone
✅ $310+ – Blue sky potential 🚀
This laddered entry strategy gives us great risk management while maximizing upside. AXP remains a solid name with strong fundamentals, making it a low-volatility winner in volatile markets.
📊 Ideal for patient traders and swing setups.
⚠️ Disclaimer: This is not financial advice. All investments involve risk. Please do your own research or consult a financial advisor before making any trading decisions.

AXP - Parabolic CurvePlotting a parabolic curve that acts as a support along the fib circle
Price dumps along each of the circle lines just to recover along the curved dotted line comes into play
The next dump will be down to the pink line after we see the finishing of bull movement
Bullish idea on this weekly timeframe

American Express: Room to Fall FurtherWhile it’s possible that we’ve already seen the low of the beige wave a, we’re not fully convinced. For now, we prepare for another potential decline toward the support at $222.03. That said, the stock should reverse well above this level and begin to rise again as part of the beige wave b, which should provide strong upward pressure. Once this corrective rebound is complete – well below the resistance at $345.03 – the final leg of the wave (IV) correction should bring the stock down into our blue Target Zone, which spans from $205.35 to $167.99. This price range is well-suited for long entries. However, reaching this Target Zone is not guaranteed. We still have to account for the possibility that the upcoming (or perhaps already settled) low may mark the end of the blue wave alt.(IV). But this 31% likely alternative scenario would only be confirmed by a breakout above the resistance at $345.03.

Close to a short term bottom... for now at least Lots of levels getting filled or near filled. Leads me to believe we may be close to a bounce. At least a short term bounce

American Express Wave Analysis – 21 February 2025
- American Express broke the support zone
- Likely to fall to support level 290.00
American Express recently broke the support zone between the support trendline of the extended daily up channel from August and the 50% Fibonacci correction of the upward impulse from December.
The breakout of this support zone accelerated the c-wave of the active minor ABC corrective wave 4 from the middle of January.
American Express can be expected to fall to the next support level 290.00 (former monthly low from January and the target for completing the active ABC wave 4).

AXP Wave Analysis – 17 February 2025
- AXP reversed from the support zone
- Likely to rise to the resistance level 315.40.
AXP recently reversed up with the daily Doji from the support zone between the pivotal support level 302.72 (former strong resistance from December and January), lower daily Bollinger Band and the 50% Fibonacci correction of the upward impulse from October.
This support zone was further strengthened by the support trendline of the daily up channel from August.
Given the clear daily uptrend, AXP can be expected to rise in the active impulse wave 5 to the next resistance level 315.40.

No New HighAnd the momentum is vaining. A correction of the rise since mid January may be expected. The more that there is an unclosed open window since 13th-14th January as well.

American Express Trade Result – RR of 1.61 on Sell & Buy SetupsI’m excited to share my latest trade idea for American Express (AXP) based on my custom indicator. The system recently signaled a sell, followed by a buy setup, each carefully calibrated with a stop loss set at our historical average loss and a take profit aligned with our historical average win—yielding a consistent risk–reward ratio of 1.61. This approach ensures disciplined entries and exits, and I’ll be updating the idea as market conditions evolve.
1. Sell Setup:
• Signal: My indicator generated a sell signal based on a confluence of conditions ( VWAP, Daily Open, and momentum parameters).
• Stop Loss (SL): The stop loss is placed according to the historical average loss observed from previous setups, ensuring controlled risk.
• Take Profit (TP): The TP is set based on the historical average win, which gives a risk–reward ratio of 1.61.
• This setup clearly shows why the system signals a sell, and the trade is entered accordingly.
2. Buy Setup:
• Signal: Shortly after the sell, the indicator generated a buy signal, suggesting a reversal in the trend.
• Stop Loss (SL): Again, the SL is determined by the historical average loss metric.
• Take Profit (TP): The TP is set using the historical average win, maintaining the same risk–reward ratio of 1.61.
• This buy setup confirms the reversal and aligns with the indicator’s overall reasoning.
. I will continue to update these ideas as new signals and market conditions arise.

Still Not CorrectedMy idea dd January 24th is still valid. Nothing has changed so far.
Thus I had taken the profit yesterday and now I am using today's rise to sell again waiting for the downward correction of the rise since October.

AXP -1d chart - long ideaI am long AXP
targets in the chart
Daily chart
It seems like once we break the ATH we can do a quick strong move higher.
SL is marked as well.
NFA
DYOR

Long Way UpSince October 2023 we have risen without a major correction. it's time now.
As the trend is still intact I don't see a correction of this whole way up now. But an attempt to correct, i.e. short term profit taking shall be possible at least.
The ADX is turning Southand the first red candle is going to built which may result in a star in the weekly chart.
I repeat: It's the time.

Speculative Madness: The Market’s Bubble Stocks Some stocks areSpeculative Madness: The Market’s Bubble Stocks
Some stocks aren't just overvalued—they're in full speculative bubble mode. Fundamentals? Irrelevant. When euphoria takes over, rationality disappears.
Here’s my list of bubble stocks that scream unsustainable pricing:
SBUX, T, PLTR, BMY, PYPL, NFLX, GS, ISRG, ARM, C, SHOP, BSX, SPOT, UBS, IBKR, RELX, CEG, CRWD, MSTR, MMM, DASH, COF...
And let’s not forget the obvious: TSLA, META, AMZN, AVGO, GOOGL, JPM, MA, V, WMT.
Honestly, the entire banking sector, brokers, and tech are in bubble territory.
What the hell is going on with this market? Why are algos just buying, buying, buying, squeezing all the shorts?! Unbelievable.
The dump will be insannnnnnnne!!! 🚨

Unleashing the Bull: Why AXP is Poised for a Breakout!Current Price: $324
Stop Loss: $310 (below key support). ( very tight SL )
TP1: $340 (short-term breakout target).
TP2: $360 (channel resistance).
TP3: $370 (analyst high target).
1️⃣ Strong Earnings Potential (Jan 24, 2025)
Analysts expect EPS of $3.03 (+15.7% YoY) and revenue of $17.18 billion (+8.8% YoY).
Solid growth driven by resilient consumer spending and premium travel recovery.
2️⃣ Premium Client Spending
AXP focuses on affluent clients, benefiting from higher spending levels and limited credit risk.
Strong performance in the travel and entertainment segments aligns with rising global travel demand.
3️⃣ Bullish Technicals
Channel Breakout: AXP has broken out above the ascending channel, signaling bullish momentum.
Indicators:
RSI above 70 indicates strong momentum.
MACD confirms bullish crossover.
Increased volume supports the breakout.
4️⃣ Interest Rate Tailwinds
Elevated interest rates enhance AXP’s interest income, bolstering profitability in its lending business.
5️⃣ Analyst Sentiment
Consensus Price Target: Analysts' median target of $360 , with high-end forecasts at $370 , offers an upside potential of 11% to 14% from the current price.

Shorting American Express. AXPAn Elliott impulse within a larger XABC zigzag (not shown), crossing indicator lines. We are willing to bed this is the start of a downward zigzag correction with view to reverse position in the event of the cross of the recent most high.

AXP is strong near all time highsAXP is not pulling in with the market, sitting less than 2% away from ATHs. The stock is relatively supper strong, not giving up much into the big selloff last few days.
I am going lont test size here. When the market finds bids, this one should move up first.
Lets see how it plays out.
Stop -297 ish

28.12.24 American Express - slowly downwardsAmerican Express is since decades Warren Buffett Darling.
AXP last years with increasing fees and solid growth spent wonderfull earnings to the shareholders, even solid dividends.
But during the last years, credit defaults increased rapidly. From quarter to quarter they increased accounting provisions.
st. louis Fed statistic also very interesting. Small banks in Us with huge defaults, meantime by 7%. Highest value since 1991, even higher than 2008…
So as a matter of fact, consumer sentiment also negativ. For 2025 expect recession and further increasing of defaults.
Expext for axp sharp slump in earnings.

AXP | SHORTNYSE:AXP
Technical Analysis of American Express (AXP)
Key Observations:
Current Price Action:
Price: $232.28
Recent Drop: -16.40 (-6.59%)
Support and Resistance Levels:
Immediate Support: $227.69 (Target Price 1)
Further Supports: $219.31 (Target Price 2), $200.36 (Target Price 3), and $186.49 (Target Price 4)
Resistance: The price broke below a previous support level at around $244.51.
Trendlines:
The upward trendline has been broken, indicating a potential shift from a bullish to a bearish trend.
Relative Strength Index (RSI):
Current RSI: 51.36
The RSI shows a recent decline, approaching a neutral level, indicating that the stock is neither overbought nor oversold.
Target Prices:
Target Price 1: $227.69
This level is the immediate support and a potential first target for any continued downward movement.
Target Price 2: $219.31
If the price breaks below the immediate support, the next target is around $219.31, a previous support level.
Target Price 3: $200.36
Further downside could see the price reaching $200.36, a significant psychological and technical support level.
Target Price 4: $186.49
In a more bearish scenario, the price could fall to $186.49, another key support level.
Summary:
American Express (AXP) has experienced a significant drop, breaking below a key support level and its upward trendline. The next levels to watch are $227.69, $219.31, $200.36, and $186.49. The RSI is neutral, suggesting the potential for further declines if market conditions remain negative.
