American Express Long Term Technical ViewAmerican Express Company, together with its consolidated subsidiaries (“American Express,” the “Company,” “we,” “us” or “our”), is a global services company that provides customers with access to products, insights and experiences that enrich lives and build business success. Our principal products and services are charge and credit payment card products and travel-related services offered to consumers and businesses around the world.
We were founded in 1850 as a joint stock association. We were incorporated in 1965 as a New York corporation. American Express Company and its principal operating subsidiary, American Express Travel Related Services Company, Inc. (“TRS”), are bank holding companies under the Bank Holding Company Act of 1956, as amended (the “BHC Act”), subject to supervision and examination by the Board of Governors of the Federal Reserve System (the “Federal Reserve”).
Our headquarters are located in New York, New York in lower Manhattan. We also have offices in other locations throughout the world.
We are principally engaged in businesses comprising four reportable operating segments: U.S. Card Services, International Card Services, Global Commercial Services and Global Network & Merchant Services, all of which are described below. Corporate functions and certain other businesses, including our Enterprise Growth Group and other operations, are included in Corporate & Other.
We compete in the global payments industry with charge, credit and debit card networks, issuers and acquirers, as well as evolving alternative payment providers. As the payments industry continues to evolve, we are facing increasing competition from non-traditional players that leverage new technologies and customers’ existing accounts and relationships to create payment or other fee-based solutions. We are transforming our existing businesses and creating new products and services for the digital marketplace as we seek to enhance our customers’ digital experiences and develop platforms for online and mobile commerce.
AXP trade ideas


Buying signs appearing on American Express chartsAMEX(NYSE:AXP)
A continued comeback in the travel business and solid buying trends among younger consumers helped American Express beat profit forecasts Friday. The company reported net income of $2.1 billion, or $2.73 per share, compared with $2.2 billion, or $2.74 per share, versus consensus of $2.40 per share. American Express AXP total revenues, +3.58 percent, were $11.74 billion, up from $9.06 billion a year ago. This was in line with analyst estimates of $11.62 billion. Amex continues to expect full-year revenue growth of 18 to 20 percent and earnings per share of $9.25 to $9.65.
Lets look at the chart of American Express Company. The STRAC indicator works very well when applied to the chart of this stock. The price has recovered from its low every time it fell below the indicator for the past six times. The indicator makes trading this stock extremely easy if history repeats itself. Traders can make a good profit within 2 weeks if they were to buy the stock whenever the price breaks below the lower band.
Next, there are many good indicators from Sharechart that you can use to determine the strength of the current downtrend in American Express Company stock. The lines within the Random Walk Index indicators, the Aroon indicator, the Elder Ray indicator, and the Kling Volume Oscillator indicator are all widely used. It is not just one, but four different indicators that send a common message that the downtrend is indeed overextended and thus the probability of a rebound is high.
The ShareChart scanner also detected a “Double Top” looks alike chart pattern that formed from the first week of March to early May. This chart pattern looks like a “Double Top” chart pattern although it does not exactly meet all the conditions of a “Double Top” chart pattern. Nevertheless, the chart pattern is useful in determining the potential price target for the current trend.
If we measure the distance between the high and the neckline of the “Double Top” chart pattern and project it down, the 100% downside target is about $154.55, as shown on the chart. This coincided with the lowest bar on the chart on 12 May 22. This is another sign that the price hit a short-term low on that day.
Assuming a trader would buy this stock at the current price, he can next use ShartChart’s Fibonacci indicator to determine the next upside potential. Using the Fibonacci indicator to measure the distance between the high and low the downtrend yields a 50% retracement value of about $171, as shown on the chart. This is the immediate price target for the rebound. The next target could be around $176, which is the 61.8% Fibonacci retracement value.
Next, the Sharechart “Volume Profile” indicator (VP) can be used to determine if 1.) the current price is considered oversold and 2.) the upside price target explained above is likely to be reached.
First, the VP indicator shows that the value reached its lowest level on May 12 as shown by the blue horizontal line on the chart. This indicates that the price may have bottomed out on that day.Similarly, the price had bottomed and reversed trend on November 30 last year when the value of VP reached the lowest level.
Secondly, the red line of VP indicator shows that the value was around $174, which means that the traded volume was the highest of the last 6 months. This should serve as a resistance level or price target in the event of a recovery. This also coincided with the 50% to 61.8% Fibonacci retracement level as explained above.
If history repeats itself, a trader who buys around the current price and sells at the potential target price of about $174 could make a good profit of 15% within the next two weeks.
Next, if we set the stop loss at $150, which the lowest points on the chart, we get a good risk-reward ratio of 174. A value above 100% is considered a good.
Before we decide to buy the stock, let us look at recent developments at American Express. On Thursday, the company continued to raise its APR in response to the Federal Reserve raising its benchmark interest rate. With the Federal Reserve planning to gradually raise the federal funds rate through 2022, it is unlikely that this will be the last APR hike this year.
American Express has also taken steps to improve security by partnering with Google to make shopping easier with an added layer of security. When using Chrome and Android Autofill.
To gain market share, American Express will now allow cardholders to cancel a flight for any reason.
While the world is full of uncertainty, the results are in line with the ambitious development goals we discussed earlier this year.”
After the results were announced, Chief Financial Officer Jeff Campbell said he still does not think there will be a recession.

Symmetrical Triangle has Broken to the DownsideAXP has broken the bottom trendline of a Symmetrical triangle.
Price has stopped at a prior bottom, for now. Time will tell if it holds.
The 50 SMA has crossed down through the 100 but not the 200.
Travel was doing well a few weeks ago. I guess almost everything is down today.
Price is below the bands set on 80 and RSI reads oversold.
The Cloud is not as bearish as many securities right now but price is sitting on the bottom of a green cloud which is support until broken. The Tenken (blue) has crossed down through the Kijun (red) and the Chikou (yellow) has crossed down through price a while back. Leading Span A (green) is trying to cross down through Leading Span B (red).
No recommendation.
There are many bearish rising wedges in this chart. Some have corrected. There is one just under 100, so price could go there and break the bottom trendline. A Rising wedge is not valid until the bottom trendline is broken.

AXP - could break support soonFinancial stocks have been pretty weak a while now with a few exceptions, AXP being one of the more resilient ones.
It has been testing a trendline support for the 4th time in the past 4.5 months and looking like a breakdown is near (in line with the overall bearish sentiment in financial stocks).
Should a close below 158 occur (ie breakdown), then the longer term target could be 132 or even 115. Howver targets are just a guide and may not may not happen. profit profits with trailing stops.
Disclaimer: Just my 2 cents and not a trade advice. Kindly do your own due diligence and trade according to your own risk tolerance and don't forget that money management is important. Take care and Good Luck!

$AXP with a Bearish outlook following its earnings #Stocks The PEAD projected a Bearish outlook for $AXP after a Negative Under reaction following its earnings release placing the stock in drift D with an expected accuracy of 63.64%.
$AXP Key levels, Analysis & TargetsAXP Key levels, Analysis & Targets
Time frame Week born Bearish Divergences in MACD & RSI Indicator

American Express USA Sun Storm Investment Trading Desk & NexGen Wealth Management Service Present's: SSITD & NexGen Portfolio of the Week Series
Focus: Worldwide
By Sun Storm Investment Research & NexGen Wealth Management Service
A Profit & Solutions Strategy & Research
Trading | Investment | Stocks | ETF | Mutual Funds | Crypto | Bonds | Options | Dividend | Futures |
USA | Canada | UK | Germany | France | Italy | Rest of Europe | Mexico | India
Disclaimer: Sun Storm Investment and NexGen are not registered financial advisors, so please do your own research before trading & investing anything. This is information is for only research purposes not for actual trading & investing decision.
#debadipb #profitsolutions

AXPhere we see the failed accumulation phase
after which a long failed rally to the top was formed
after which we see a sharp rally down the zone testing

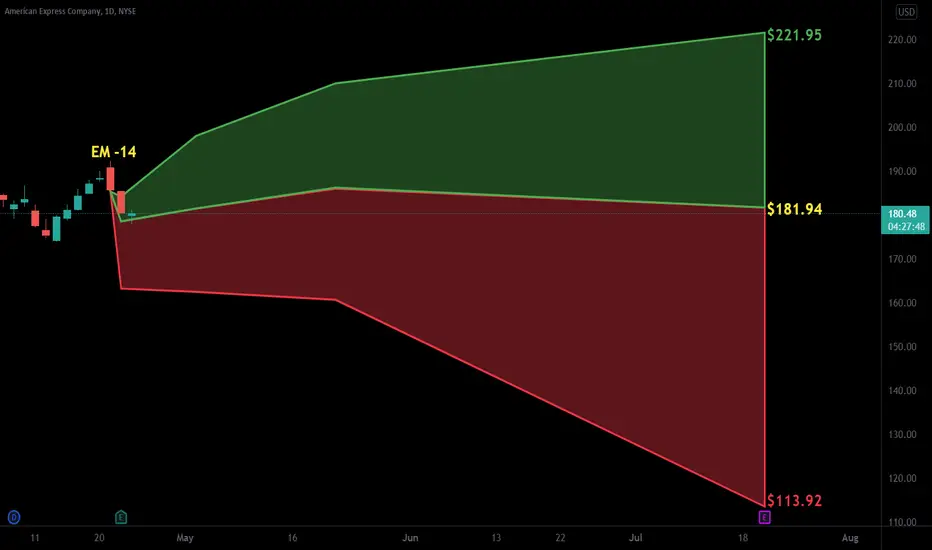
Another short on American. AXPOh yes!
Goals 151, 146, 140. Invalidation at 211.
We are not in the business of getting every prediction right, no one ever does and that is not the aim of the game. The Fibonacci targets are highlighted in purple with invalidation in red. Fibonacci goals, it is prudent to suggest, are nothing more than mere fractally evident and therefore statistically likely levels that the market will go to. Having said that, the market will always do what it wants and always has a mind of its own. Therefore, none of this is financial advice, so do your own research and rely only on your own analysis. Trading is a true one man sport. Good luck out there and stay safe

Axp long swing | AXP | LONG @ 192 - 196 | TP @ 198, 200, 202, 204, 206 | SL @ 168 | PATTERN = ASCENDING TRIPLE TOP BREAKOUT |
Swing trade idea. Kindly follow targets and stop loss. Will update with new targets once all 5 are achieved.

AXPBad week for AXP. Weekly RSI divergence forming as price is potentially putting in a double top at the 1.618 extension. Bearish below ath, looking for $157 next.


$AXPDouble bottom into a bull flag. We should see a little pullback then another break towards ATH. If that doesn't occur look for the stock to fall to the lower levels.
CHART LEGEND:
white dashed lines = bull/bear takeovers
blue lines = call targets
yellow lines = put targets
red line = danger zone
orange lines = trend lines
green lines = safe zone
any other lines add will be discussed with the ticker
NYSE:AXP

AXP - A dash of "old school" and "new school" togetherA few key measures, and several types of PnF setups.

AMX - Weekly view shows a different pictureShows breakout potential if it builds above 170 zone....might be good for another 100 pts or so.

AMX - short candidate below 180
IF it closes below 159, I expect downtrend to start and accelerate below 150.
Confirmation is needed, but if the overall market weakness continues, or if the relief rally pushes up to ATH, this would be a good value on the short side.

American Express AXP - Short Setup With Risk/Reward 5.95American Express has hit an interesting level for a short based on price action. Risk/Reward to first PT is excellent at 5.95.

Down with American Express. AXP Another short in the financial markets. Short term outlook only.
Immediate targets 159, 151. Invalidation at 214.
We are not in the business of getting every prediction right, no one ever does and that is not the aim of the game. The Fibonacci targets are highlighted in purple with invalidation in red. Fibonacci goals, it is prudent to suggest, are nothing more than mere fractally evident and therefore statistically likely levels that the market will go to. Having said that, the market will always do what it wants and always has a mind of its own. Therefore, none of this is financial advice, so do your own research and rely only on your own analysis. Trading is a true one man sport. Good luck out there and stay safe

Head and ShouldersBe safe.
Price has not broken neckline and the neckline is a strong source of support.
Once price has broken neckline, down targets may be valid.
If price breaks the neckline, then possible stop above the neckline.
No recommendation.
Megaphone pattern is a pattern that consists of minimum of higher highs and lower lows.
The pattern is generally formed when the market is highly volatile in nature and traders are not confident about the market direction.
Megaphone pattern is known to give multiple trading opportunities to the trade but will often make 5 swings and break up or down. It does not go on forever and is considered a broadening pattern.
This pattern also can be traded when it fails but is necessary to identify the failure perfectly.
Sometimes only pattern is not enough to take best trading decisions you may need multiple indicators to identify better entry and exit points

AXP - Short on Watch May reject here within this triangle or extend this wave higher into 180's. Ultimately, a better long term buy in the 140's imo.

AXP | Puts** Not financial advice, for journaling purposes only. please feel free to send me your analysis**
Options: 01/21 $160 @ 2.49
- AXP has formed a bearish pennant
- The last few days candle(s) are wicked down
- MACD curving down (D)
- TTM Squeeze (D)
- Price needs to cross 9EMA/200SMA and hold

AXP_TRIANGLE PATERNAt the bottom of the channel is completing the "D" of the triangle pattern.
The RSI should also cross with the 50 level.
