Another Example of an RSI Can Stay OverboughtAs seen in BA, an overbought RSI can stay overbought. For swing shorting, I like to wait until the stock crosses under the daily ATR trailing stop, even if it means missing the beginning of the move.
BA trade ideas

Boeing: Week of December 11thBullish /Bearish conditions in the chart.
Tough one next week with the fundamentals, though for actual equities FOMC rate decisions and CPI don't have the same effect on individual tickers as it does on the indices. The reaction generally is more tame and may only derail a ticker momentarily or serve as a catalyst to bring it to where it wants to go.
In terms of the probability, its pretty mixed. Momentum is on the bullish side (with around 73% accuracy on BA) and Neutral probs based on Standard Deviation is on the bearish side (with 75% accuracy).
(This also can signal that we will hit both targets, like we did last week with BA where it went for the lows first then catapulted from PL1 to PH3).
We can see that price accumulation, by standard deviation, actually rests towards the low targets. BA has indeed been straight up but we will see what happens.
At the end of the day, let the PA do the talking. Watch for conditional breaks.
Safe trades everyone!

Boing H4 - 13.12.23We anticipate a decline in Boeing stock, which we believe completed the Elliott 5th wave with 8 weeks of continuous ascent. Initially, we expect a drop to $230, and if this level is breached, we anticipate a decline to $222, corresponding to the 38.2% level.


BA8 straight weeks up..
Daily RSI is hi fiving pluto. Still volume is strong and no reversal candle has been shown..
I think BA will correct along With DJI in the coming days back to 230 minimum.
Daily RSI along with candles are both at resistance

Boeing Stairsteps for Swing TradingNYSE:BA has the most powerful and longest momentum run of all of the 30 Dow components. The company reports earnings on January 24th and the run up implies that the 4th quarter is likely to be better than previous quarters in 2023.
This stock has moved strongly since the bottom in November and has been able to pattern out some of the speculation with stairsteps to keep the run moving upward beyond the resistance level of its range trend.
Some of this movement upward is ETF developers building more ETF units for certain industries and corporations.
Profit-taking is likely soon for this swing trade as it nears the long-term resistance at the 2021 highs. However, there is now support from the range of the August highs.

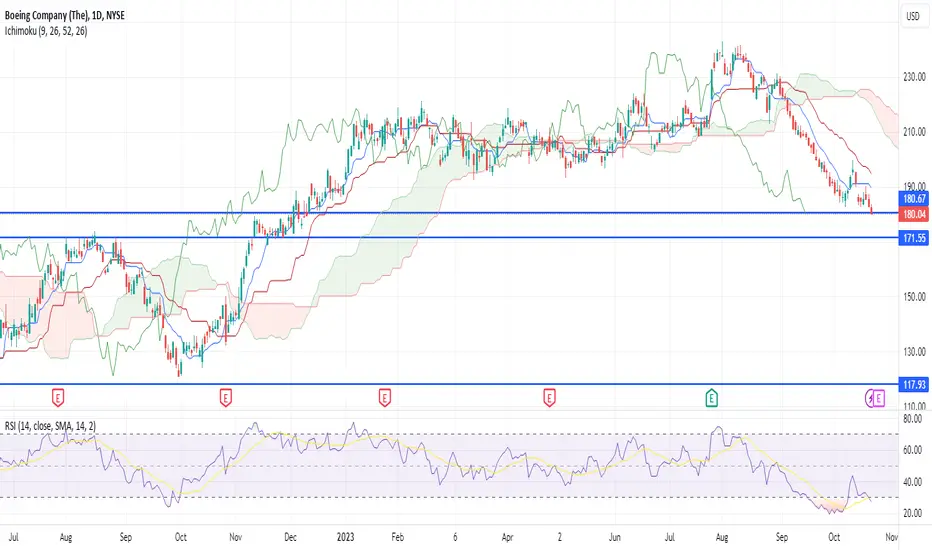
BA - Ascending Triagle [MID-TERM]💡 RSI: 94 Strong
💡 Risk: Medium
✅ Resistance: 267
✅ Support: 238
PERFORMANCE
🟢 ST: POSITIVE
🟢 MT: POSITIVE
🟢 LT: POSITIVE
*ST: Short-term | MT: Mid-term | LT: Long-term
Verify it first and believe later.
WavePoint ❤️

BA: First week of November I decided to just highlight the standard deviation/accumulation ranges with the rectangles.
Based on this, we may see a pullback into next week, but not likely to see a move to the bottom of the range.
Bias is still to the upside for me personally on BA and I think it will follow the rest of the market if we go up.
I have been holding BA shares and slowly adding through this year and will continue to do so on pullbacks.
Safe trades!
Note:
I will continue to update this idea with intra-day levels for BA throughout the week.
So feel free to follow along if you are a BA day trader :-).


BoeingHello friends
In the Boeing share, we see a full 5 waves.
After these 5 waves, we see a clear 5 micro wave.
These 5 waves can only be seen in zigzags that have a 5-3-5 structure.
So we expected a 3-wave up which happened.
And considering that 78.6% of these 5 micro-waves have been corrected, we expect the price to drop.
At the same time, a hidden divergence is also observed.
The price target is $175 and then $163.
Be successful and profitable.

BA Bottom Is In...I Think...113ish is our long term support. We have bounced there many times. Green downtrend channels pre covid til now is being broken out of. I expect one small pull back on or around rate hike day. Then Go Long!!!!

BA: Dec 1st As NASDAQ:NVDA and NYSE:BA have been my go tos this week, going to share the intra-day levels and plan for tomorrow.
Threshold break to the upside, target bull tgt #2.
Else to the downside, bear tgt #2.
Pullback is possible leading into tomorrow but generally the outlook for BA is positive and we should continue to see upward movement.
I will post an actual weekly outlook on BA for next week.
Safe trades!

BoeingHello friends
In Boeing's share, a 5 wave of the main cycle has been completed.
We expected a correction, which has been achieved.
Wave A of correction is completed as a 5-wave.
We expected a 3-wave pattern in a zigzag pattern, which did not materialize.
Currently, a 5th wave has been formed, which is a micro wave of wave B, and divergence has been identified in it.
Probably, wave B is a complex, so the 5 formed micro waves are probably wave A from wave B, which should be a zigzag or flat.
Therefore, we expect a 3-wave in the form of wave B from B and then a 5-wave in the form of wave C.
Fibonacci ratio of 61.8 correction and static resistance drawn at $222 and completion of 5 micro-waves and price gap and triple divergence are confirmations to enter the sell position.
Therefore, by breaking the upward trend line, you can enter the sell position.
The price target is $175.
Be successful and profitable.

Boeing and US Partner To Boost Sustainable Aviation Fuel In APECBoeing (NYSE:BA), in collaboration with the U.S. Department of Transportation and the Federal Aviation Administration (FAA), has taken a significant step towards environmental sustainability by spearheading an initiative to increase the use of Sustainable Aviation Fuel (SAF) across Asia-Pacific Economic Cooperation (APEC) nations. This move aligns with the International Civil Aviation Organization's (ICAO) goal of achieving net-zero carbon emissions by 2050.
The aerospace giant has outlined a comprehensive strategy to overcome the current limitations of SAF, which currently accounts for only 0.1% of international jet fuel consumption. Recognizing the urgent need to scale up SAF supplies, Boeing's Chief Sustainability Officer Chris Raymond highlighted the importance of this initiative for meeting environmental targets in aviation.
Boeing is not only advocating for policy changes but is also actively involved in various collaborations to educate stakeholders about sustainable aviation fuels. These efforts include researching innovative technologies alongside Zero Petroleum, exploring bio feedstock opportunities worldwide, supporting Japan's ACT FOR SKY program for domestic SAF commercialization, and aiming to ensure its fleet is fully compatible with SAF by 2030.
The company has already made substantial progress by incorporating over 7 million gallons of SAF into its commercial operations. This initiative within APEC, supported by the U.S., represents a broader commitment to sustainable energy practices and is part of Boeing's participation in the World Energy Council's initiatives.
Through these efforts, Boeing and its partners aim to empower APEC member states with the tools and knowledge necessary to transition towards a more sustainable aviation industry, thereby contributing significantly to global efforts to reduce carbon emissions in air travel.
Price Momentum
BA is trading in the middle of its 52-week range and near its 200-day simple moving average.
What does this mean?
Investors are still evaluating the share price, and the stock is still trying to generate some momentum. This is a Positive sign for the stock's future value.

BOEING: This breakout will be a Christmas gift to buyers.Boeing opened much higher today, turned overbought on the 1D timeframe (RSI = 70.408, MACD = 1.220, ADX = 33.303) and is about to hit the 1D MA200 for the first time in two months. Since the long term pattern is a Channel Up, dated back more than one year, a candle close over the 1D MA200, will be a bullish extension signal much like November 7th 2022. If it happens, it will be a pre-Christmas bargain, buy and target the R1 level (TP = 243.00).
## If you like our free content follow our profile to get more daily ideas. ##
## Comments and likes are greatly appreciated. ##

Boeing (NYSE: BA) Secures $11 Billion Deal.Boeing (BA) shares are climbed today after the company secured major deals with Emirates Airline. Emirates agreed to purchase 90 Boeing 777 jets valued at $52 billion, while sister airline Flydubai will add 30 Boeing 787 Dreamliners to its fleet in an $11 billion deal.
This deal comes as Emirates faces increasing competition in the Middle East, including from Turkish Airlines which plans to add 600 new planes to its fleet. The deals were announced at the Dubai Air Show amid declining travel demand in the region resulting from the Israel-Hamas conflict.
Technical Analysist
Price Momentum
BA is trading in the middle of its 52-week range and below its 200-day simple moving average.
What does this mean?
Investors are still evaluating the share price, but the stock still appears to have some downward momentum. This is a negative sign for the stock's future value.

BoeingHello friends
In Boeing stock, we see the completion of a 5-wave pattern
Because wave A is 5 waves, therefore, the shape of the correction wave ABC is very likely
Therefore, we expect limited growth in the form of wave B and much more fall in the form of ABC.
But if our theory is correct, first the ascending wave B will form, then the descending wave C will be formed and the price will decrease to around $140.
Good luck

BA (Boeing)Monthly chart 3 black crows candlestick = Bearish
Weekly chart
Gravestone doji Reversal candle with strong volume. = Bullish.
Daily chart falling wedge pattern that would take us back to 198-200..
I seriously doubt we break over 200 because of the price action and weekly 200sma.

$BA Long Swing NYSE:BA had a confirmed “Larkquidity” Sweep signal from the Jeanius indicator. Which means it has stopped taking out lows, so I will be enter a long trade targeting the high of October, using the low of October as a stop loss.

Boeing Company: The Underpressured PathBoeing results topped analyst expectations Wednesday thanks to a pickup in commercial aircraft deliveries as the manufacturer increases production, but losses in its defense and space businesses drove the manufacturer into the red for the quarter.
The company generated $2.6 billion of free cash flow in the second quarter, ahead of analyst forecasts, and reiterated its full-year guidance of between $3 billion and $5 billion of free cash flow.
Boeing shares surged 12.70% just in a week, and closed on Friday at $238.69, the stock’s highest closing price since November 2021.
Here’s how the company performed during the period ended June 30, compared with Refinitiv consensus estimates:
👉 Adjusted loss per share: 82 cents vs. 88 cents.
👉 Revenue: $19.75 billion vs. $18.45 billion
👉 Boeing and main rival Airbus have both struggled to increase aircraft production in the wake of the Covid pandemic as some airlines face longer waits for new jets, just as travel demand rebounds.
The company delivered 136 planes in the second quarter, up from 121 aircraft during the same period last year.
Meanwhile just a take a look what historically happened with Boeing stocks, almost every time after 10+ percent weekly advance. In simple words - that's been a flat, or even more than 10 percent decline.
Technical picture indicates that Bearish trend still is in power in NYSE:BA stocks, and 5yrs SMA is still a huge resistance.

BA The Boeing Company Options Ahead of EarningsIf you haven`t bought the dip on BA here:
Then analyzing the options chain and the chart patterns of BA The Boeing Company prior to the earnings report this week,
I would consider purchasing the 182.50usd strike price Calls with
an expiration date of 2023-11-3,
for a premium of approximately $5.05.
If these options prove to be profitable prior to the earnings release, I would sell at least half of them.
Looking forward to read your opinion about it.

BA BUY ++++BA is and has been oversold for some time, we are at near strong support I would expect a bounce back to $205 in coming weeks
Boeing (BA) Looking to End Impulsive Decline SoonShort Term Elliott Wave in Boeing (BA) suggests the decline from 8.1.2023 high is unfolding as a 5 waves impulse. Down from 8.1.2023 high, wave 1 ended at 212.88 and wave 2 rally ended at 231.17. The stock then extends lower in wave 3 towards 182.55, and wave 4 rally ended at 199.65. Internal subdivision of wave 4 unfolded as a zigzag. Up from wave 3, wave ((a)) ended at 188.64 and pullback in wave ((b)) ended at 185.68. Final leg wave ((c)) higher ended at 199.65 which completed wave 4.
The stock has resumed lower in wave 5 with internal subdivision as a 5 waves impulse. Down from wave 4, wave ((i)) ended at 194.27 and rally in wave ((ii)) ended at 196.99. The stock extended lower in wave ((iii)) towards 183.18 as an impulse. Down from wave ((ii)), wave (i) ended at 191.6 and rally in wave (ii) ended at 193.68. The stock resumed lower in wave (iii) towards 185.55 and wave (iv) rally ended at 188.59. Final leg wave (v) ended at 183.18 which completed wave ((iii)). Bounce in wave ((iv)) ended at 186.91.
Expect the stock to extend lower 1 more leg in wave (v) to complete wave ((v)) of 5 of (A). Afterwards, it should rally in wave (B) to correct cycle from 10.11.2023 high in 3, 7, or 11 swing before the decline resumes. Near term, as far as pivot at 199.65 high stays intact, expect rally to fail in 3, 7, or 11 swing for further downside.
